If we want a better world, we have to get a sense of how much energy it would take. First we look at the status quo, then we envision some hypothetical scenarios.
Methodology - general
First we define the scale (X axis) (same for every bar graph):
- 1 pixel ≡ 32 Mtoe/year
px
32 Mtoe/year
1 pixel on the X axis scale of the bar graphs
The next sections are the methodologies for each bar graph.
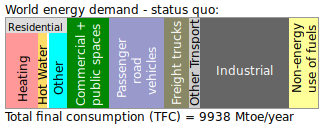
Status quo
Using data from IEA (international energy agency):
Source (1) has general stats about worldwide total final energy consumption (TFC), and what share of that is used in industry and transport.
Source (2) has more detailed breakdowns for energy usage types, but they are only based on a handful of countries - mostly developed countries (...)( Australia, Belgium, Canada, Czech Republic, Finland, France, Germany, Hungary, Italy, Japan, Korea, Luxembourg, New Zealand, Spain, the United Kingdom and the United States. ).
We use these together, to estimate how energy is used globally.
energy.tfc
9937.70 Mtoe/year
Global energy usage - total final consumption (TFC)
Includes: fuel (80.7%) + electricity (19.3%) AFTER it is generated.
Does not include the fuel used in generating electricity.
Source: (1)
oecd.energy.tfc
9937.70 Mtoe/year
Global energy usage - total final consumption (TFC)
Includes: fuel (80.7%) + electricity (19.3%) AFTER it is generated.
Does not include the fuel used in generating electricity.
Source: (1)
non_energy_use
916.76 Mtoe/year
Fossil fuels used for purposes other than burning; for example making plastics
Worldwide total. Measured in energy units.
Source: (1)
industry.energy
2839.31 Mtoe/year
Industrial energy usage - worldwide total
Source: (1)
transport.energy
2890.90 Mtoe/year
Transporation's energy usage - worldwide total
Includes passenger and freight/cargo.
Source: (1)
buildings.energy
3290.73 Mtoe/year
Energy used in all buildings including houses - worldwide total
Source: (1) - second row from the bottom ("Other") - rightmost column ("Total")
transport.stfc
33.0%
All transportation - share of total final energy consumption
Based on 16 developed countries.
Source: (2)
passenger_road_transport.stfc
20.1%
Passenger road vehicles - share of total final energy consumption
Includes cars, vans, buses, etc.
Based on 16 developed countries.
Source:(2)
freight_road_transport.stfc
9.0%
Freight road vehicles - share of total final energy consumption
Includes the trucks that transport goods.
Based on 16 developed countries.
Source: (2)
air_and_water_transport.stfc
3.2%
Planes, ships and boats - share of total final energy consumption
Includes both passenger and cargo.
Based on 16 developed countries.
Source: (2)
rail_transport.stfc
0.7%
Trains - share of total final energy consumption
Based on 16 developed countries.
Source: (2)
manufacturing.stfc
24.7%
Manufacturing - share of total final energy consumption
Based on 16 developed countries.
Source: (2)
agriculture.stfc
2.3%
Agriculture - share of total final energy consumption
Based on 16 developed countries.
Source: (2)
mining.stfc
3.9%
Mining - share of total final energy consumption
Based on 16 developed countries.
Source: (2)
construction.stfc
1.2%
Construction - share of total final energy consumption
Based on 16 developed countries.
Source: (2)
residential.stfc
20.8%
Homes - share of total final energy consumption
Based on 16 developed countries.
Source: (2)
services.stfc
14.1%
Commercial and public spaces - share of total final energy consumption
Based on 16 developed countries.
Source: (2)
cooling_air_residential.stfc
0.8%
Cooling (air conditioning) - share of total final energy consumption
Based on 16 developed countries.
Source: (2)
heating_air_residential.stfc
10.8%
Home heating - share of total final energy consumption
Does not include water heating.
Based on 16 developed countries.
Source: (2)
heating_water_residential.stfc
3.2%
Home water heaters (hot water) - share of total final energy consumption
Based on 16 developed countries.
Source: (2)
industrial.stfc
manufacturing.stfc + mining.stfc + construction.stfc + agriculture.stfc
Industrial - share of total final energy consumption
Based on 16 developed countries.
Source: (2)
Note that this is wildly different from industry.energy which is global. That's because a lot of manufacturing happens in poorer countries.
Residential heating
heating_air_residential.stfc / (residential.stfc+services.stfc) * buildings.energy
px rh
(calculation loading)
Residential hot water
heating_water_residential.stfc / (residential.stfc+services.stfc) * buildings.energy
px rw
(calculation loading)
Residential cooling
cooling_air_residential.stfc / (residential.stfc+services.stfc) * buildings.energy
px rc
(calculation loading)
Residential other (...)( includes cooking, appliances, lighting, computers etc. )
residential.stfc / (residential.stfc+services.stfc) * buildings.energy - rh - rw - rc
px ro
(calculation loading)
Commercial & public spaces (...)( No data available on how much is heating vs nonheating. )
services.stfc / (residential.stfc+services.stfc) * buildings.energy
px cp
(calculation loading)
Road vehicles (passenger)
passenger_road_transport.stfc / transport.stfc * transport.energy
px pr
(calculation loading)
Road vehicles (freight trucks)
freight_road_transport.stfc / transport.stfc * transport.energy
px fr
(calculation loading)
Ships, trains, planes
(air_and_water_transport.stfc+rail_transport.stfc) / transport.stfc * transport.energy
px aw
(calculation loading)
Industrial
industry.energy
px
(calculation loading)
Non-energy use of fuels (...)( Included in order to match the energy supply bar chart on the main energy page. )
non_energy_use
px
(calculation loading)
Total final consumption
rh + rw + rc + ro + cp + pr + fr + aw + industry.energy + non_energy_use
Mtoe/year
(calculation loading)
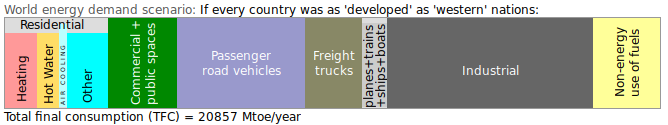
If every country was as "developed" as western nations
Take the numbers from the status quo, and scale up some of them.
Use the ratio of energy-per-capita, in developed countries vs world average.
oecd.energy.tfc
3784.37 Mtoe/year
OECD countries - energy usage - total final consumption
Key World Energy Statistics 2020 (IEA report)
- Page 49: OECD energy balance, 2018
oecd.population
1291087000
Number of people living in OECD countries
Source: [PDF] Population and Migration - OECD
Using data from 2020
OECD countries are: Austria, Australia, Belgium, Canada, Chile, Colombia, Costa Rica, Czech Republic, Denmark, Estonia, Finland, France, Germany, Greece, Hungary, Iceland, Ireland, Israel, Italy, Japan, Korea, Latvia, Lithuania, Luxembourg, Mexico, the Netherlands, New Zealand, Norway, Poland, Portugal, Slovak Republic, Slovenia, Spain, Sweden, Switzerland, Turkey, the United Kingdom and the United States.
world.population
7.875 billion
Number of people alive today, globally
https://www.unfpa.org/data/world-population-dashboard
Last updated in 2021
oecd.energy.tfc / oecd.population * world.population / energy.tfc
scale_up
(calculation loading)
Residential heating - not scaled, because most developing countries are in warm climates.
rh
px
(calculation loading)
Residential more - scaled
rw * scale_up
px
(calculation loading)
rc * scale_up
px
(calculation loading)
ro * scale_up
px
(calculation loading)
Commercial & public spaces
We have to scale just the non-heating component, but we don't have exact data on it. Best estimate: assume that the status quo is 50/50 heating & nonheating (similar to residential). So we scale up half of it.
50% cp + 50% cp*scale_up
px
(calculation loading)
Transport - scaled
pr * scale_up
px
(calculation loading)
fr * scale_up
px
(calculation loading)
aw * scale_up
px
(calculation loading)
Industrial - scaled (...)( because even though some developing countries have a lot of industry already, much of it goes to making goods that get exported to developed countries. So to make that kind of material wealth for the whole world, industries have to be even bigger. )
industry.energy * scale_up
px
(calculation loading)
Non-energy use of fuels - scaled
non_energy_use * scale_up
px
(calculation loading)
Total final consumption
rh + rw*scale_up + rc*scale_up + ro*scale_up + 50% cp + 50% cp*scale_up + pr*scale_up + fr*scale_up + aw*scale_up + industry.energy*scale_up + non_energy_use*scale_up
Mtoe/year
(calculation loading)
Minimum
This bar graph has not been made yet. It will be based on the minimal consumption scenario.

