File:energy-usage-by-source.png
energy-usage-by-source.png (336 × 300 pixels, file size: 32 KB, MIME type: image/png)
Summary
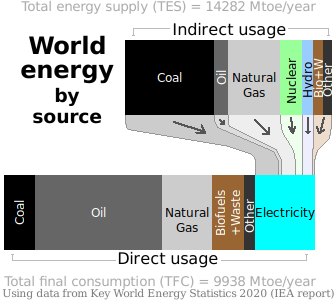
X axis scale: 1 pixel = 32 Mtoe/year [?]Mtoe stands for "million tonnes of oil equivalent". See also: Energy units
Top bar: Energy used to generate electricity *(for simplicity sake)Technically, 22% of the top bar is other things: losses, energy industry's own use, etc. But that would make the graph too complicated for some people lol .
Bottom bar: Total final consumption (TFC) [?]Includes, for example, gasoline used in cars, electricity used in buildings, coal used in factories, etc.
Total energy supply (TES) [?]Also known as "primary energy consumption" - this consists of energy sources in their original form, before any transformation. : top bar + bottom bar - electricity
Methodology
Using data from Key World Energy Statistics 2020 (a report published by IEA (International Energy Agency)).
Top bar
Calculated from the numbers on Page 47 - "Simplified energy balance table" - World energy balance, 2018
| Coal | (3838.33 - 994.50) Mtoe/year |
| Oil | (4585.52 - 12.59 - 88.52 - 4038.50) Mtoe/year |
| Natural gas | (3261.59 - 1611.35) Mtoe/year |
| Nuclear | 706.81 Mtoe/year |
| Hydro | 362.33 Mtoe/year |
| Biofuels and waste | (1327.13 - 1012.37) Mtoe/year |
| Other | 288.70 Mtoe/year |
Electricity generated by source
Using percentages from Page 30 - "Electricity generation by source" - 2018 pie chart
| Coal | 38.2% |
| Oil | 2.9% |
| Natural gas | 23.1% |
| Nuclear | 10.2% |
| Hydro | 15.8% |
| Other | 9.8% |
Bottom bar
Using numbers from Page 34 - "World total final consumption (TFC) by source" - 2018 pie chart
| Total | 9937.70 Mtoe/year [''']the extra precision was provided on Page 47 |
| Coal | 10.0% |
| Oil | 40.8% |
| Natural gas | 16.2% |
| Biofuels and waste | 10.2% |
| Other | 3.5% |
| Electricity | 19.3% |
Design decisions
Why say "Mtoe/year" when the original source says just "Mtoe" and "year 2018":
- This bar graph is supposed to be a general overview of the world's rate of energy consumption. At the time of making it, 2018 was just the most recent year with detailed data available. Energy consumption changes every year, but not a whole lot.
(...)( The long term trend is that it grows about 2%/year (except for recessions in 2008 and 2020) )
Why put 'other' before 'electricity' in the bottom bar:
- Because it makes it easier to visually see all of TES together.
File history
Click on a date/time to view the file as it appeared at that time.
| Date/Time | Thumbnail | Dimensions | User | Comment | |
|---|---|---|---|---|---|
| current | 10:02, 16 October 2023 | | 336 × 300 (32 KB) | Elie (talk | contribs) | Redesigned for (hopefully) better clarity! |
| 17:06, 20 May 2023 |  | 336 × 256 (26 KB) | Elie (talk | contribs) | moved the title words, so people don't get confused and only look at the top bar | |
| 20:14, 30 May 2022 |  | 336 × 256 (26 KB) | Elie (talk | contribs) | Top bar: Energy used to generate electricity {{p2|mostly|We say this for simplicity sake. Technically, 22% of it is other things (losses, the energy industry's own use, etc). }}. Bottom bar: Total final consumption (TFC) Total energy supply (TES): top bar + bottom bar - electricity |
You cannot overwrite this file.
File usage
The following 2 pages use this file:
- Energy
- File:Energy-usage-by-source.png (file redirect)