File:food-crop-production1.png
Size of this preview: 800 × 400 pixels. Other resolution: 2,160 × 1,080 pixels.
Original file (2,160 × 1,080 pixels, file size: 736 KB, MIME type: image/png)
Summary
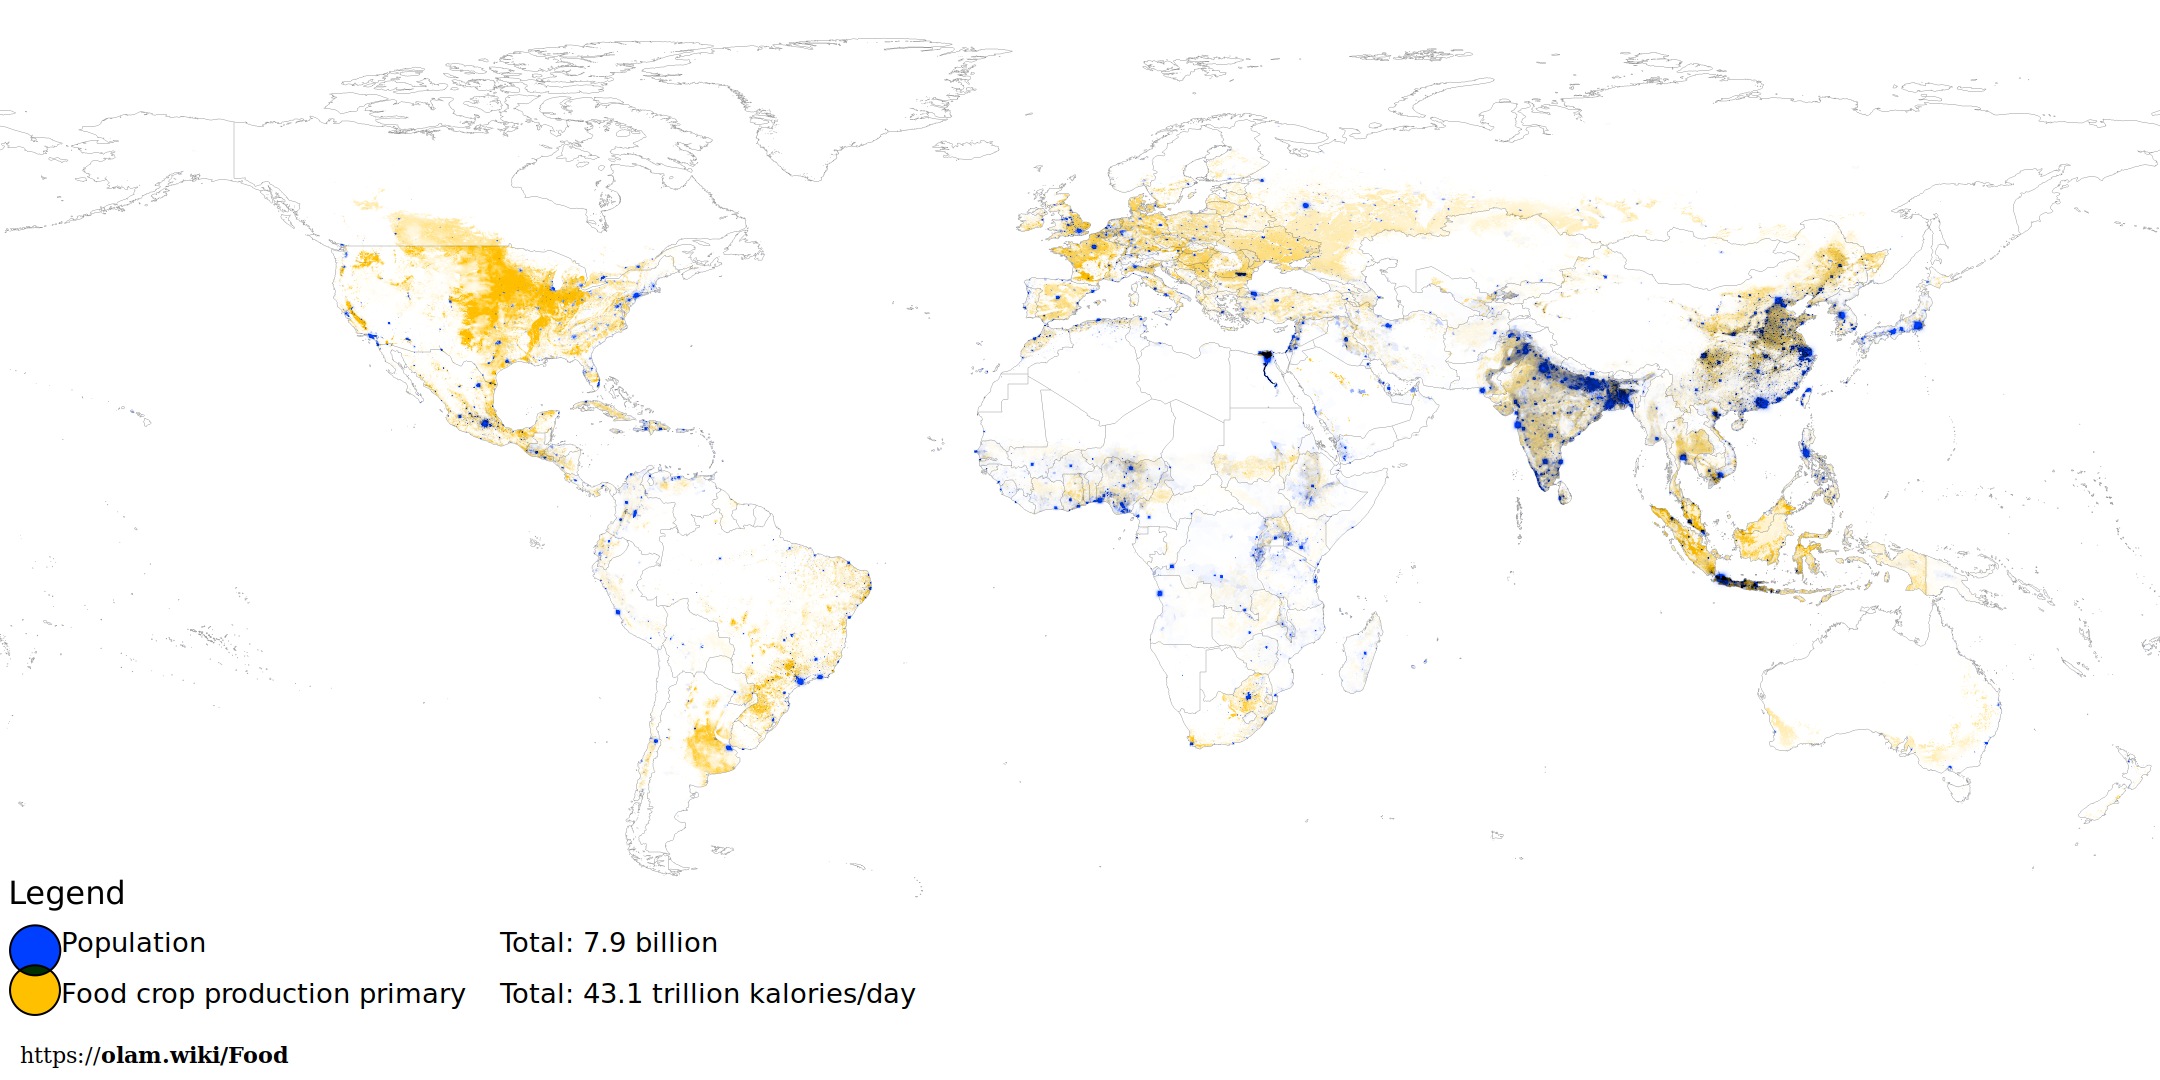
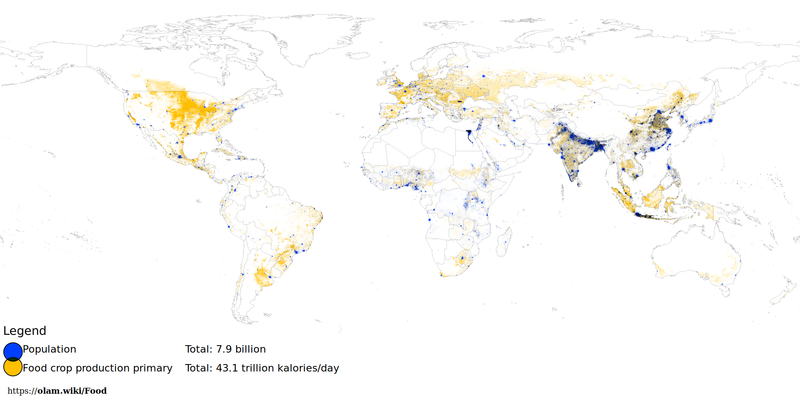
Production of food crops, superimposed on population.
Isochromic world map (projection: equirectangular/geographic)
Methodology
Made from data:
- File:population.data-float64-8640x4320
- File:cropland.data-float32-4320x2160
- File:countries.data-int16-8640x4320
- File:yields.data-float64-895x1
Image generator code:
# load files
pop << data/population.data-float64-8640x4320 # population counts
crop << data/cropland.data-float32-4320x2160  # cropland fraction of land
yield << data/countries.data-int16-8640x4320  # country codes
yields << data/yields.data-float64-895x1      # crop yields (average kalories/day/acre) by country code
yield [] yields       # now 'yield' is a map of crop yields
borders << data/borders-black-on-white.png

# fill in blanks (default values)
crop _= 0
crop >= 0
yield _= 12546.6943934817  # from food1.sql: SELECT SUM(production_kalories_per_day)/SUM(farmland_acres) FROM main WHERE region_name="World";

# scale everything to 2160x1080
pop @@ $width/4
pop @@ $height/4
crop @@ width/2
crop @@ height/2
yield @@ width/4
yield @@ height/4
borders @@ width/4
borders @@ height/4

# make the borders a bit fainter
borders -= 1
borders *= 0.4
borders += 1

# calculate food production
crop @@ density_to_quantity # now 'crop' is crop land in km^2
crop *= 247.10538           # now 'crop' is crop land in acres
crop *= yield               # now 'crop' is crop production in kalories/day

# generate output...

out.r := pop
out.r /= 500000 # max people per pixel
out.r @@ spread
out.r @@ negative

out.b := crop
out.b /= 1250000000 # max kalories/day per pixel
out.b @@ spread
out.b @@ negative

out.g := out.r
out.g *= 3
out.g += out.b
out.g /= 4

out.r *= borders
out.g *= borders
out.b *= borders

out >> data/food-crop-production1.png
Legend (html):
<table style="font-family:sans-serif"><tr style="line-height:2em"><td>
<span style="background-color:#003FFF; border:1px solid"> </span>
</td><td>
Population
</td><td>
Total: 7.9 billion
</td></tr><tr><td>
<span style="background-color:#FFC000; border:1px solid"> </span>
</td><td>
Food crop production primary 
</td><td>
Total: 43.1 trillion kalories/day
</td></tr></table>
<p><small>https://<b>olam.wiki/Food</b></small></p>
File history
Click on a date/time to view the file as it appeared at that time.
| Date/Time | Thumbnail | Dimensions | User | Comment | |
|---|---|---|---|---|---|
| current | 13:06, 14 August 2022 | | 2,160 × 1,080 (736 KB) | Elie (talk | contribs) | Made the legend bigger |
| 12:18, 13 August 2022 | 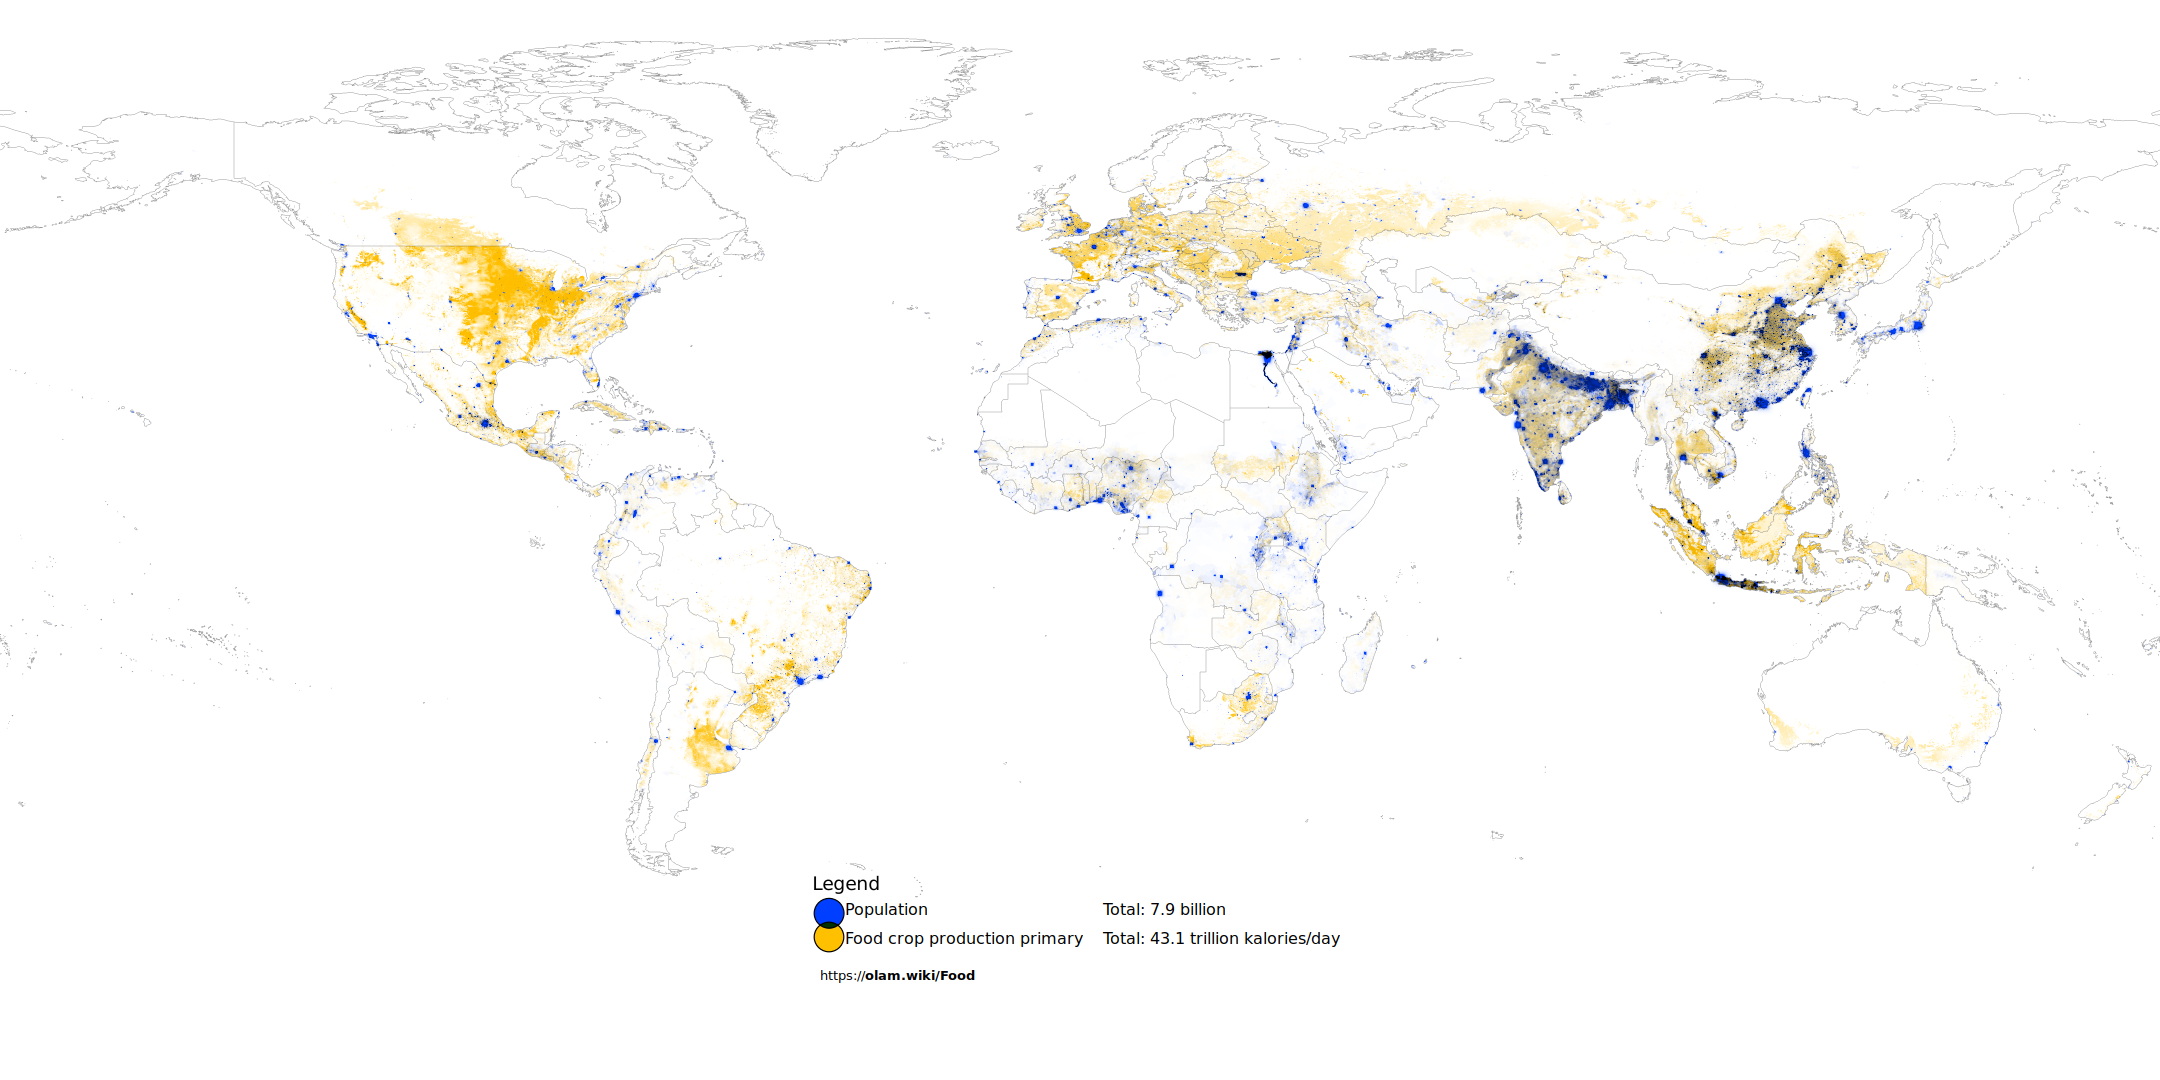 | 2,160 × 1,080 (726 KB) | Elie (talk | contribs) | Production of food crops, superimposed on population. Isochromic world map (projection: equirectangular/geographic) |
You cannot overwrite this file.
File usage
The following 3 pages use this file: