File:food-funnel.png

Original file (453 × 1,010 pixels, file size: 38 KB, MIME type: image/png)
Summary
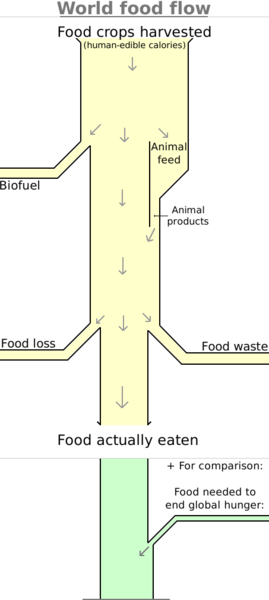
The world produces more than double the amount of food crops needed to feed everyone. But after all the waste, losses, and animal agriculture, there isn't enough food left to go around; people still go hungry.
Overview
"The world produces enough food, but where does it all go?"
This diagram shows the main inefficiencies of the global food supply.
It visualizes the relative proportion of:
- food crops harvested from farms (a.k.a. the production primary)
- food burned as biofuel
- food fed to animals
- food produced by animals
- food loss
- food waste
- food actually eaten
For animal feed, the diagram does not count grasses, crop residues, or anything else inedible to humans. The diagram strictly shows the usage of human-edible foodstuffs.
Methodology
The thickness of each branch in the diagram, is proportional to the human-edible calories of food involved.
All the per-capita numbers below are calculated as (total food) divided by (world population).
Food Crops Harvested: 5454 kalories/day/capita
- calculated by Code:food1.sql
- SQL code:
SELECT SUM(production_kalories_per_day)/7.9e9 FROM main WHERE region_name="World";
- SQL code:
MINUS: Biofuels: 491 kalories/day/capita
- calculated as 9% of Food Crops Harvested. The '9%' comes from [1] and refers to calories.
MINUS: Animal feed: 1964 kalories/day/capita
- calculated as 36% of Food Crops Harvested. The '36%' comes from [2] and refers to calories.
PLUS: Animal products: 518 kalories/day/capita
- calculated from Code:food2.sql
- SQL code:
SELECT SUM(kalories_per_day_per_capita) FROM summary;
- SQL code:
Now we're at: 3518 kalories/day/capita
- Call this the "Supply".
MINUS: Food loss: 493 kalories/day/capita
- calculated as 14% of Supply. The '14%' comes from [3] which doesn't specify protein or calories or mass or volume, we just have to assume.
MINUS: Food waste: 598 kalories/day/capita
- calculated as 17% of Supply. The '17%' comes from [4] which doesn't specify protein or calories or mass or volume, we just have to assume.
- More details derived from the same source:
- Household food waste - 387 kalories/day/capita (calculated as 11% of Supply)
- Food service waste - 176 kalories/day/capita (calculated as 5% of Supply)
- Retail waste - 70 kalories/day/capita (calculated as 2% of Supply) (percentages don't add up due to rounding errors; this causes kalories to not add up either)
Food Actually Eaten - 2427 kalories/day/capita
- Net result.
- However, this is a global average. 10% of the world is still undernourished, living on less than 1800 kalories/day.
Finally, to estimate the food that would be needed to end global hunger, we add 2400 kalories/day
252 kalories/day/capita
The diagram shape was generated by Code:make-flow-diagram1.html, and the resulting image was edited to add annotations and coloring.
Notes
Geography
This diagram is a world overview.
It would be worthwhile to also create local versions of this diagram, by country. Note that the diagrams would be more complex because of imports & exports at every stage.
If the diagram was done for rich countries such as the USA, the 'food waste' and 'animal feed' sections would be proportionally a lot bigger.
File history
Click on a date/time to view the file as it appeared at that time.
| Date/Time | Thumbnail | Dimensions | User | Comment | |
|---|---|---|---|---|---|
| current | 23:48, 18 February 2024 | | 453 × 1,010 (38 KB) | Elie (talk | contribs) | Moved the lines slightly, for clarity |
| 09:10, 16 February 2024 |  | 453 × 1,010 (38 KB) | Elie (talk | contribs) | Removed the footer of the image | |
| 18:02, 24 August 2022 |  | 453 × 1,024 (43 KB) | Elie (talk | contribs) |
You cannot overwrite this file.
File usage
The following 3 pages use this file:
- Food
- Hunger
- File:Food-funnel.png (file redirect)