File:food-funnel.png

Original file (453 × 1,010 pixels, file size: 38 KB, MIME type: image/png)
Summary
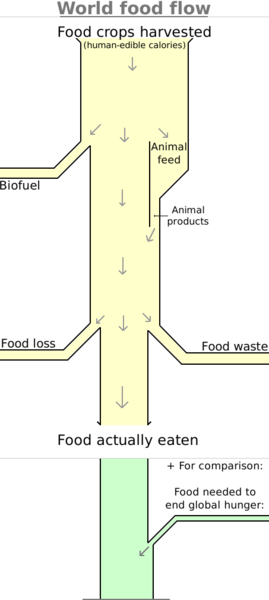
"The world produces enough food, but where does it all go?"
This diagram shows the main inefficiencies of the global food supply.
It visualizes the relative proportion of:
- food crops harvested from farms (a.k.a. the production primary)
- food burned as biofuel
- food fed to animals
- food produced by animals
- food loss
- food waste
- food actually eaten
For animal feed, the diagram does not count grasses, crop residues, or anything else inedible to humans. The diagram strictly shows the usage of human-edible foodstuffs.
Methodology
The thickness of each branch in the diagram, is proportional to the human-edible calories of food involved.
All the per-capita numbers below are calculated as (total food) divided by (world population).
Food Crops Harvested: 5454 kalories/day/capita
- calculated by Code:food1.sql
- SQL code:
SELECT SUM(production_kalories_per_day)/7.9e9 FROM main WHERE region_name="World";
- SQL code:
MINUS: Biofuels: 491 kalories/day/capita
- calculated as 9% of Food Crops Harvested. The '9%' comes from [1] and refers to calories.
MINUS: Animal feed: 1964 kalories/day/capita
- calculated as 36% of Food Crops Harvested. The '36%' comes from [2] and refers to calories.
PLUS: Animal products: 518 kalories/day/capita
- calculated from Code:food2.sql
- SQL code:
SELECT SUM(kalories_per_day_per_capita) FROM summary;
- SQL code:
Now we're at: 3518 kalories/day/capita
- Call this the "Supply".
MINUS: Food loss: 493 kalories/day/capita
- calculated as 14% of Supply. The '14%' comes from [3] which doesn't specify protein or calories or mass or volume, we just have to assume.
MINUS: Food waste: 598 kalories/day/capita
- calculated as 17% of Supply. The '17%' comes from [4] which doesn't specify protein or calories or mass or volume, we just have to assume.
- More details derived from the same source:
- Household food waste - 387 kalories/day/capita (calculated as 11% of Supply)
- Food service waste - 176 kalories/day/capita (calculated as 5% of Supply)
- Retail waste - 70 kalories/day/capita (calculated as 2% of Supply) (percentages don't add up due to rounding errors; this causes kalories to not add up either)
Food Actually Eaten - 2427 kalories/day/capita
- Net result.
- However, this is a global average. 10% of the world is still undernourished, living on less than 1800 kalories/day.
Finally, to estimate the food that would be needed to end global hunger, we add 2400 kalories/day
252 kalories/day/capita
The diagram shape was generated by Code:make-flow-diagram1.html, and the resulting image was edited to add annotations and coloring.
Notes
Geography
This diagram is a world overview.
It would be worthwhile to also create local versions of this diagram, by country. Note that the diagrams would be more complex because of imports & exports at every stage.
If the diagram was done for rich countries such as the USA, the 'food waste' and 'animal feed' sections would be proportionally a lot bigger.
Limitations
This diagram doesn't currently include fish. Here's one way that fish could maybe be included in future versions of this diagram:
- The top part would be renamed from 'crops harvested' to 'production primary', and would include wild-caught fish.
- The 'animal feed' would include any human-edible calories fed to farmed fish.
- The 'animal products' produced would include the farmed fish.
To put things in perspective, seafood contributes about 12g protein/day/capita to the global food supply. [6]
The image's top & bottom text are redundant for most wiki pages, but needed in case someone shares the image.
File history
Click on a date/time to view the file as it appeared at that time.
| Date/Time | Thumbnail | Dimensions | User | Comment | |
|---|---|---|---|---|---|
| current | 23:48, 18 February 2024 | | 453 × 1,010 (38 KB) | Elie (talk | contribs) | Moved the lines slightly, for clarity |
| 09:10, 16 February 2024 |  | 453 × 1,010 (38 KB) | Elie (talk | contribs) | Removed the footer of the image | |
| 18:02, 24 August 2022 |  | 453 × 1,024 (43 KB) | Elie (talk | contribs) |
You cannot overwrite this file.
File usage
The following 3 pages use this file:
- Food
- Hunger
- File:Food-funnel.png (file redirect)