File:map-population-foodProduction.png
Size of this preview: 800 × 400 pixels. Other resolutions: 2,560 × 1,280 pixels | 4,320 × 2,160 pixels.
Original file (4,320 × 2,160 pixels, file size: 1.75 MB, MIME type: image/png)
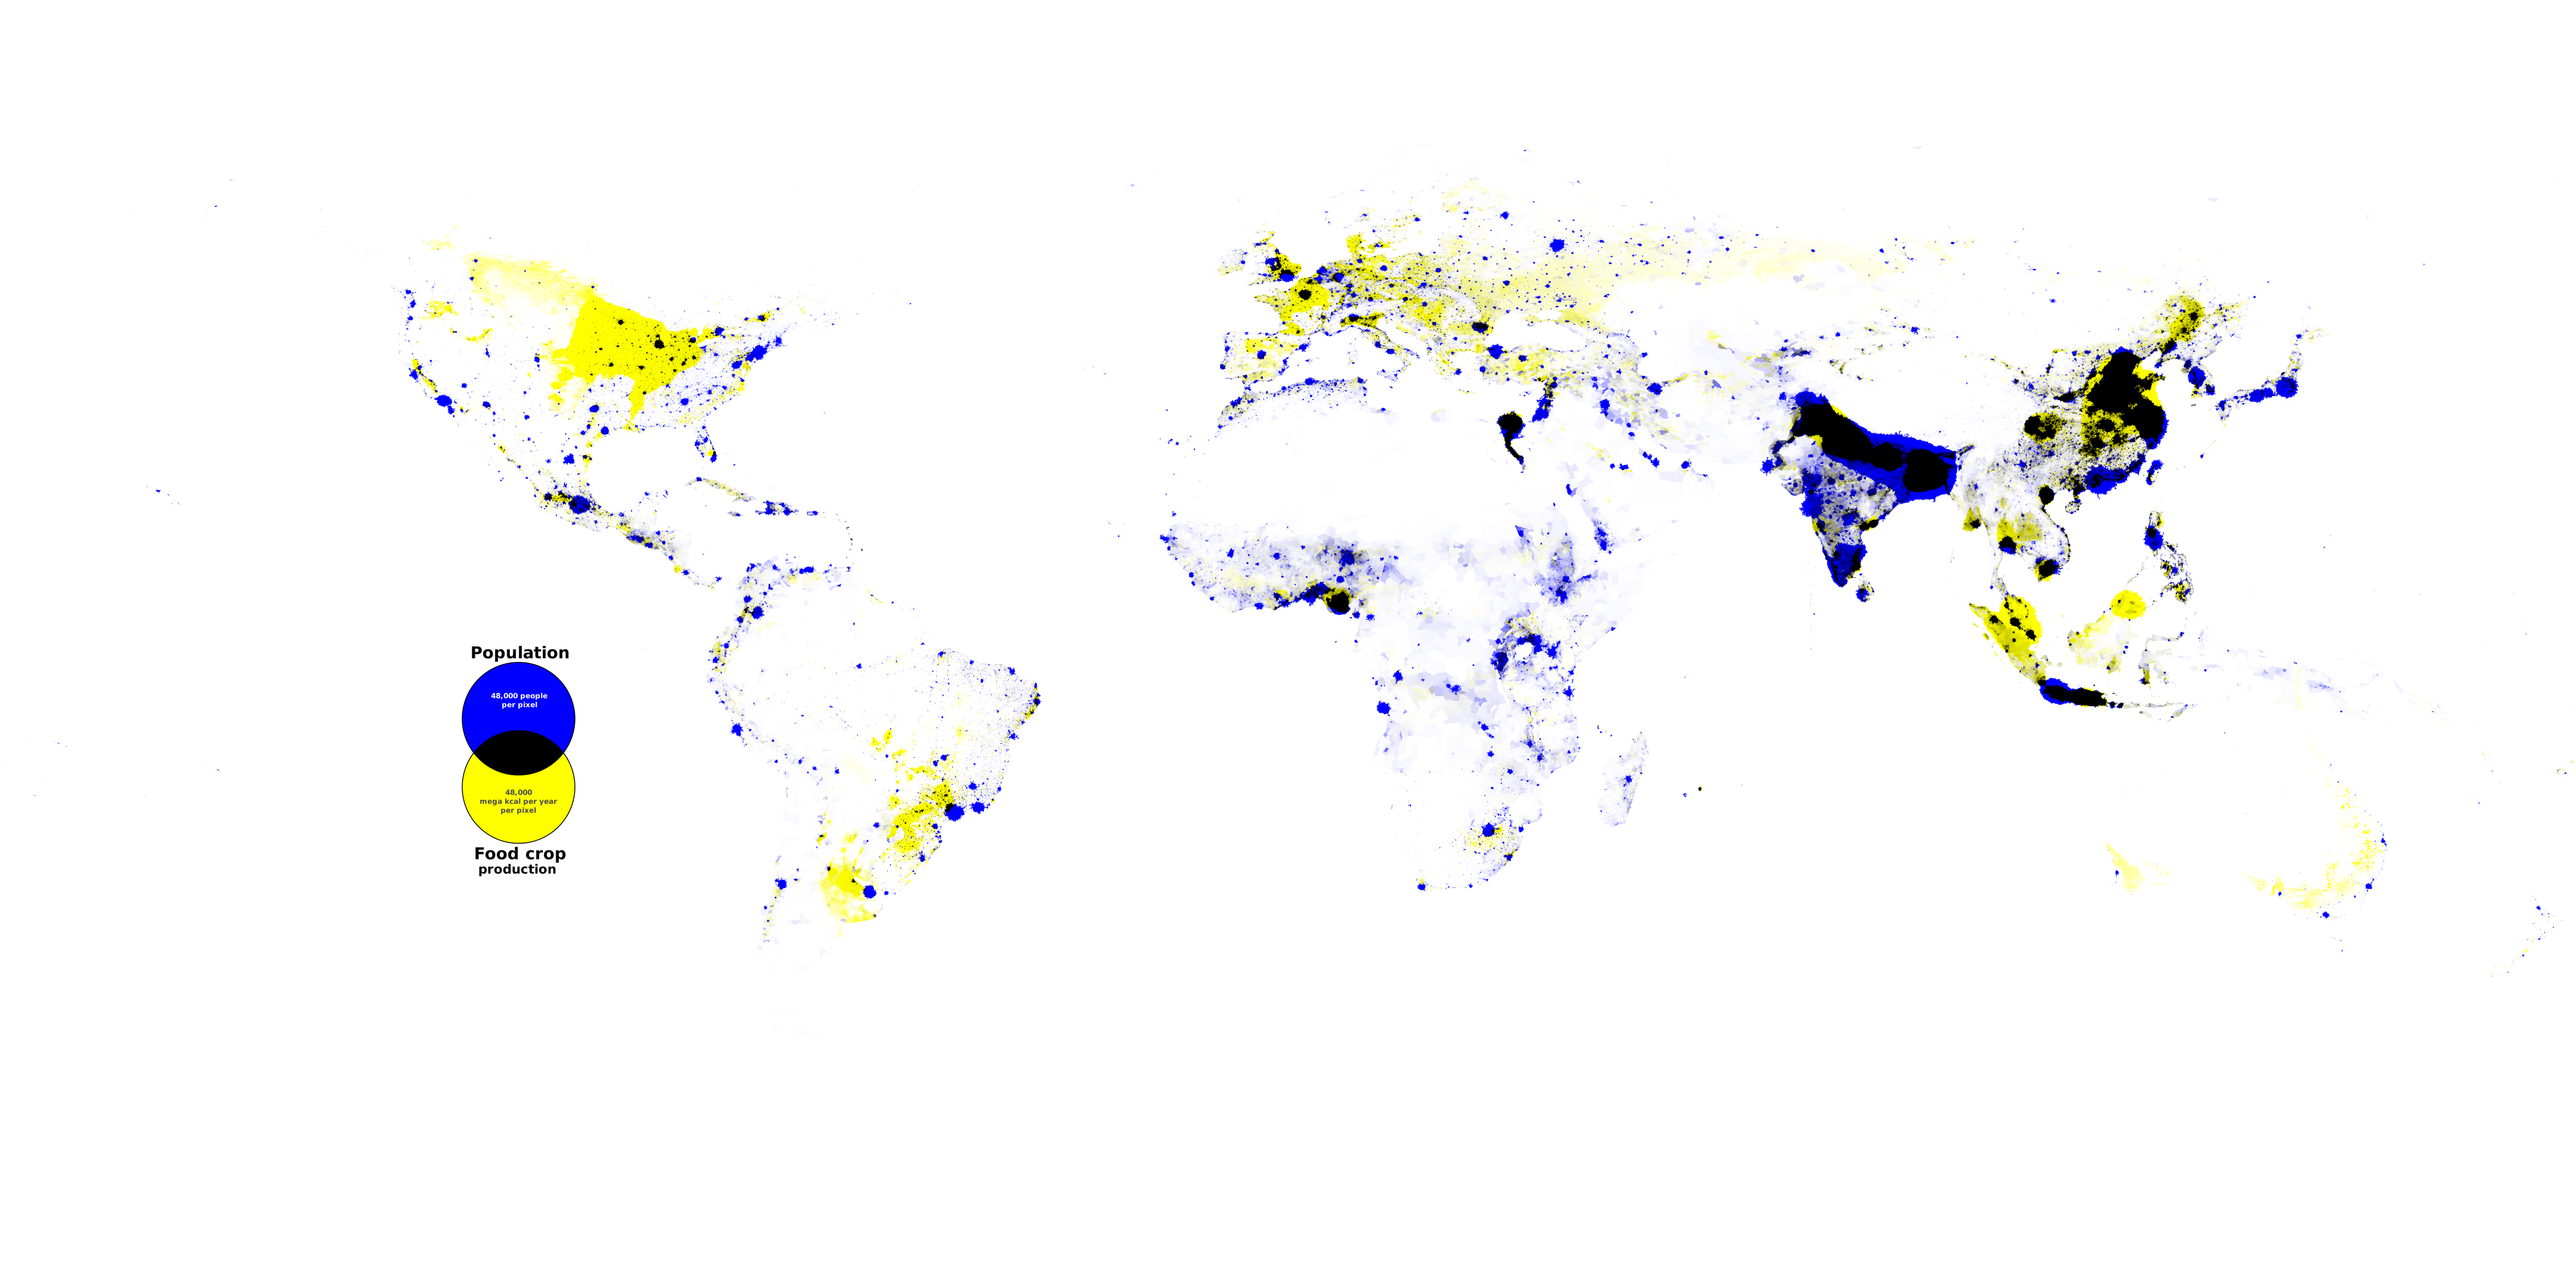
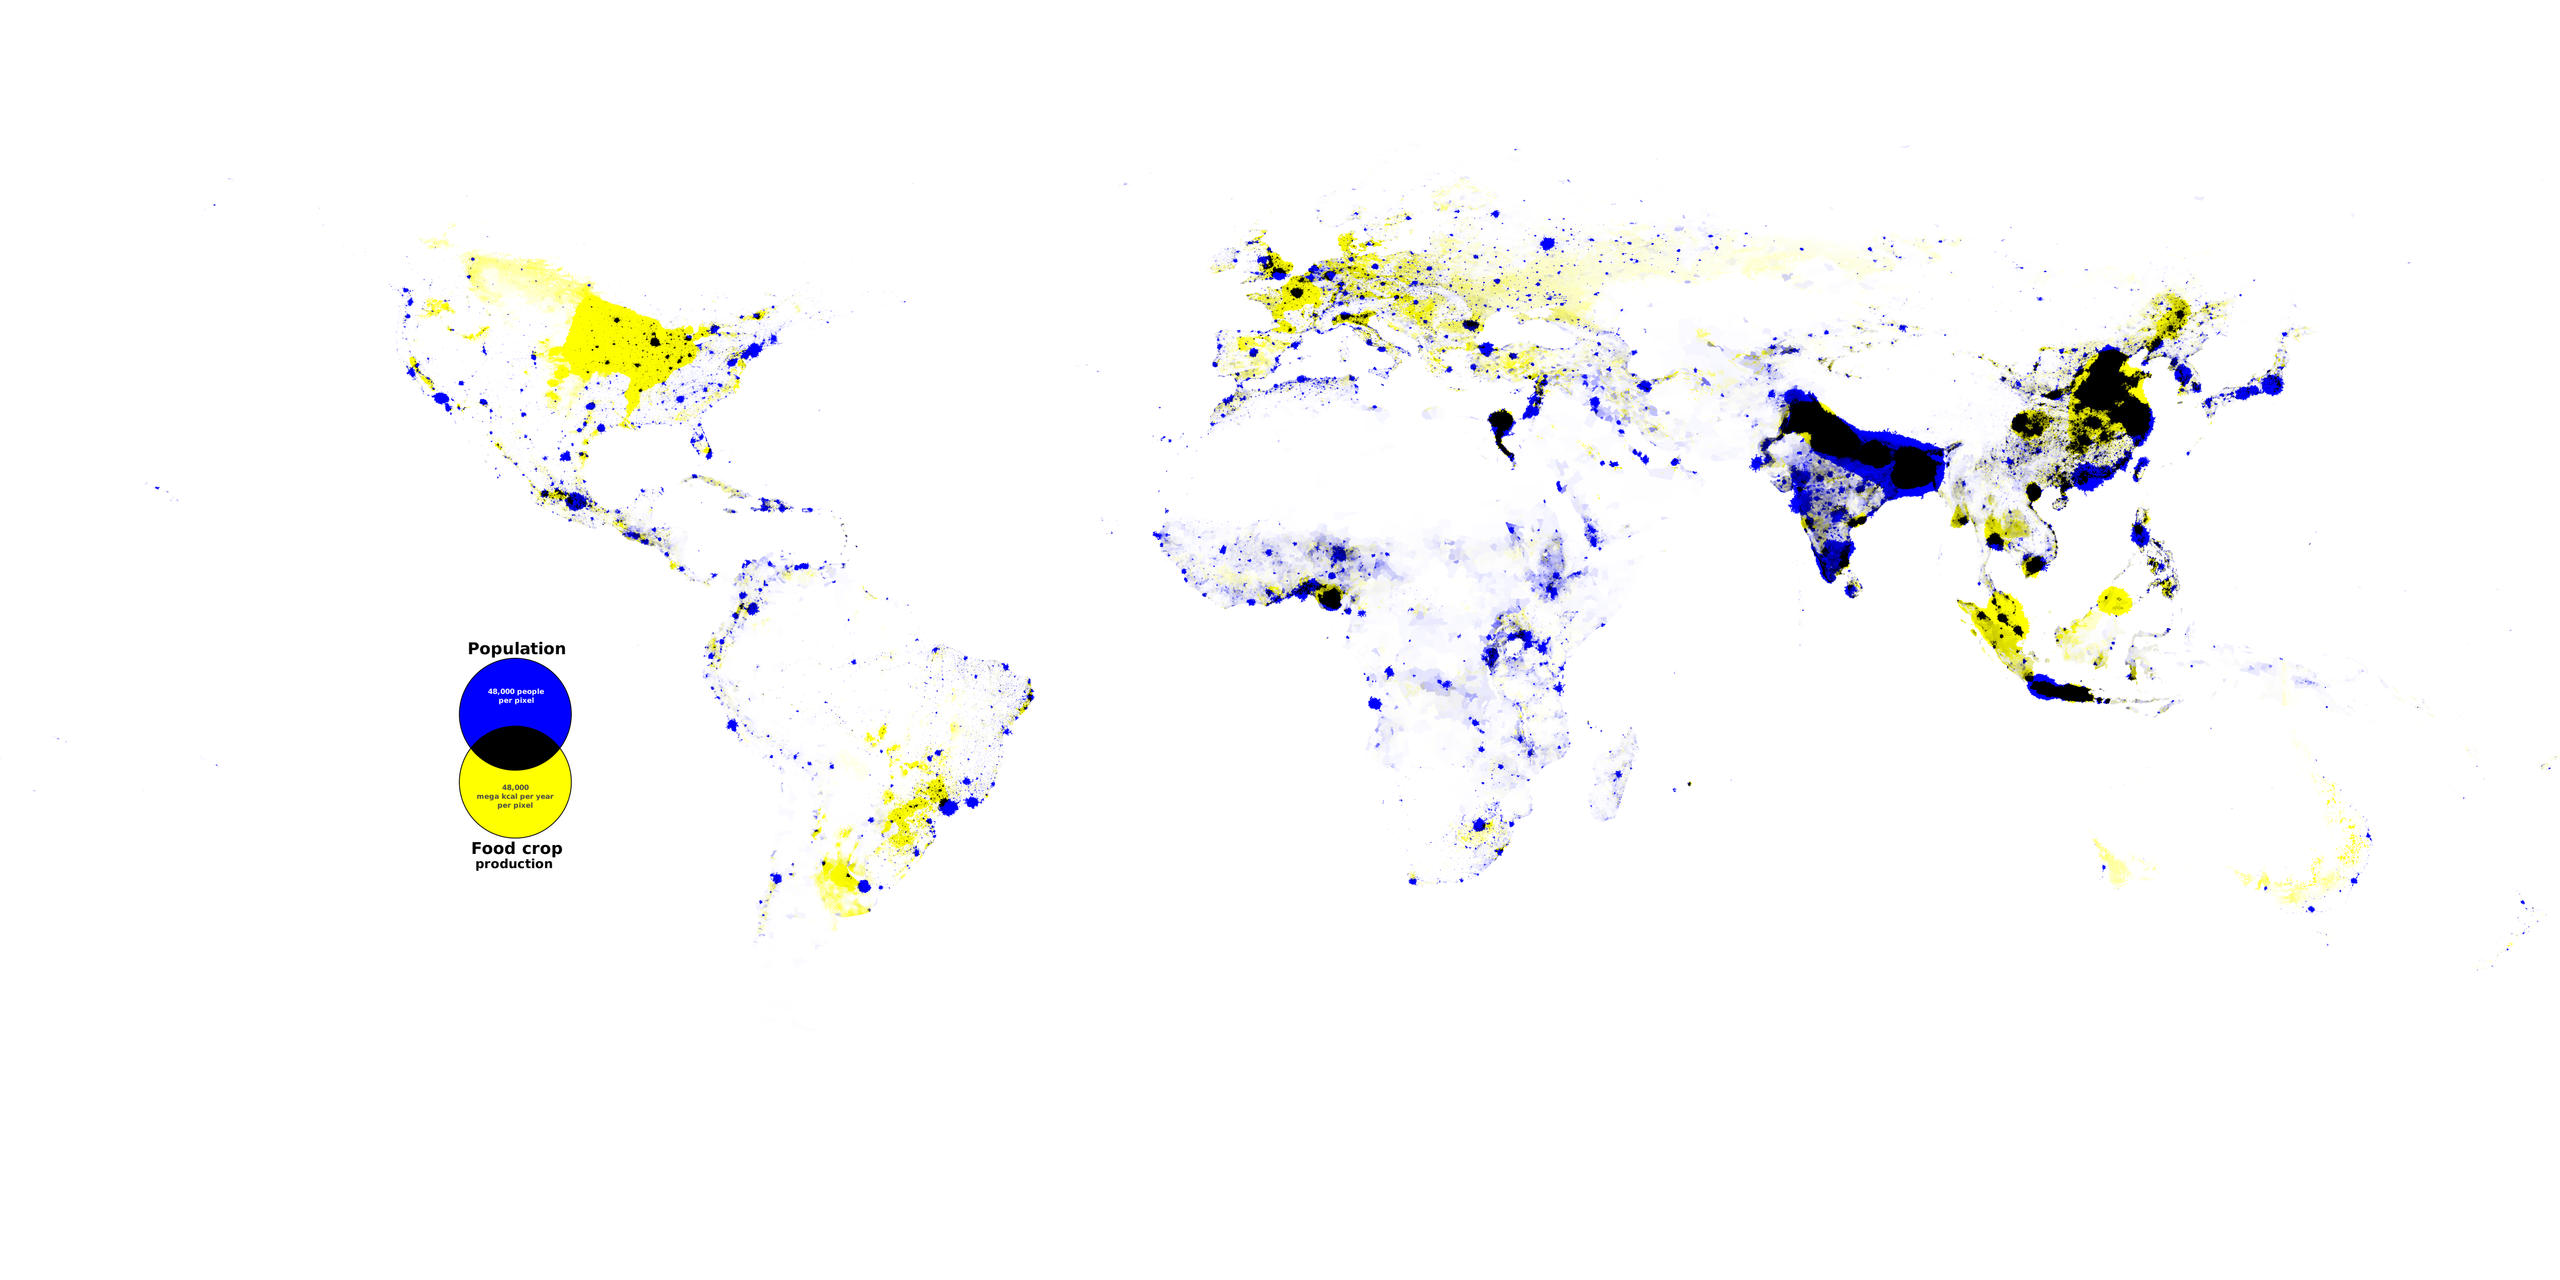
Food production in yellow, population in blue.
The population pixels have been visually 'spread' to make them easier to see. A 50/50 balance of blue and yellow indicates that enough food is produced to feed the population.
Units: 1 million kcal/year = enough food to feed 1 person.
File history
Click on a date/time to view the file as it appeared at that time.
| Date/Time | Thumbnail | Dimensions | User | Comment | |
|---|---|---|---|---|---|
| current | 18:13, 18 May 2022 | | 4,320 × 2,160 (1.75 MB) | Elie (talk | contribs) |
You cannot overwrite this file.
File usage
The following 2 pages use this file:
- Local food
- File:Map-population-foodProduction.png (file redirect)