Uncategorized files
Showing below up to 70 results in range #1 to #70.
-

-
CroplandPastureArea2000 Geotiff.zip File missing
-
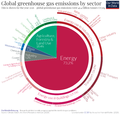
 Emissions-by-sector-–-pie-charts.png 1,302 × 1,233; 265 KB
-
 Furniture wasted on moving day.jpg 1,280 × 720; 285 KB
-
 GHG-Emissions-By-Sector-1200px.webp 1,200 × 1,136; 288 KB
-
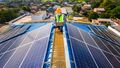
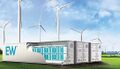
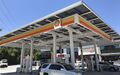 GasStationRooftopSolar1.jpg 2,000 × 1,250; 375 KB
-
-
 PRIMARY-Blue Marble 2002.png 1,600 × 800; 903 KB
-
 RooftopSolar1.jpg 800 × 450; 131 KB
-
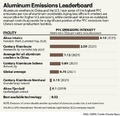 aluminum-pfc-emissions.png 700 × 674; 237 KB
-
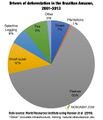 amazon-deforestation-drivers-2001-13-960.jpg 930 × 1,080; 133 KB
-
 blue-marble-posterized.png 1,600 × 800; 30 KB
-
borders-black-on-white.png 8,640 × 4,320; 677 KB
-
 carbon-inequality1.png 754 × 524; 119 KB
-
continents-black-on-white.png 8,640 × 4,320; 529 KB
-
continents-edges-black-on-white.png 8,640 × 4,320; 610 KB
-
countries.data-int16-8640x4320 ; 289 KB
-
-
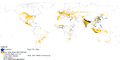
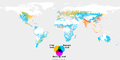
 crop-yields-map.png 4,320 × 2,160; 3.42 MB
-
cropland.data-float32-4320x2160 ; 3.57 MB
-
 energy-demand-if-developed.png 668 × 125; 22 KB
-
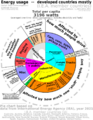 energy-demand-pie1.png 812 × 1,052; 341 KB
-
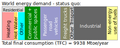 energy-demand-status-quo.png 325 × 130; 17 KB
-
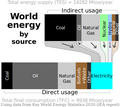 energy-usage-by-source.png 336 × 300; 32 KB
-
fao-crops-primary.csv ; 10.6 MB
-
fao-crops-processed.csv ; 415 KB
-
fao-livestock-primary.csv ; 4.54 MB
-
font.data-uint8-1004x19 ; 19 KB
-
 food-crop-production1-if-crop-choices.png 2,160 × 1,080; 787 KB
-
 food-crop-production1.png 2,160 × 1,080; 736 KB
-
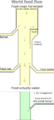
 food-funnel-old.png 485 × 718; 45 KB
-
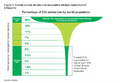
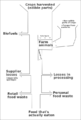
 food-funnel.png 453 × 1,010; 38 KB
-
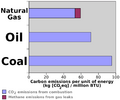 fossil-fuels-ghg-by-energy.png 944 × 784; 44 KB
-
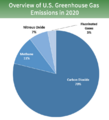 ghg-usa-2020.png 640 × 702; 79 KB
-
global-hunger-index-2021.csv ; 4 KB
-
global-hunger-index-2021.xlsx ; 47 KB
-
gpw-v4-population-count-rev11 2020 2pt5 min asc.zip File missing
-
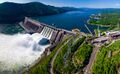 hydropower1.jpg 650 × 400; 106 KB
-
 info-icon.svg 620 × 620; 1 KB
-
 irfb1.jpg 541 × 311; 49 KB
-
 land-builtup1.png 1,600 × 800; 205 KB
-
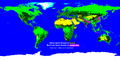
 land-crop1.png 1,600 × 800; 302 KB
-
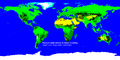 land-pasture1.png 1,600 × 800; 351 KB
-
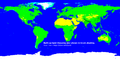
 land-usage1.png 1,600 × 800; 356 KB
-
 land-usage2.png 4,320 × 2,160; 3.08 MB
-
 land-wild1.png 1,600 × 800; 772 KB
-
land water.png 8,640 × 4,320; 1.99 MB
-
map-energy-population.png 8,640 × 4,320; 3.77 MB
-
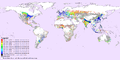
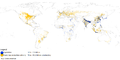
 map-population-foodProduction.png 4,320 × 2,160; 1.75 MB
-
mont-royal-vs-quebec-scale.mkv ; 5.55 MB
-
mont-royal-vs-quebec-scale.mp4 ; 2.42 MB
-
 mont-royal-vs-quebec-scale.ogv ; 3.55 MB
-
 nutritionCalculator-cheapHomeCooking1.png 559 × 1,664; 195 KB
-
 nutritionCalculator-junkFood1.png 559 × 1,424; 166 KB
-
 nutritionCalculator-lowCarb1.png 559 × 1,536; 189 KB
-
 nutritionCalculator-naturalVegan1.png 559 × 1,680; 195 KB
-
pasture.data-float32-4320x2160 ; 4.09 MB
-
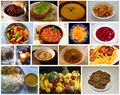 plant-based-examples1.jpg 740 × 584; 187 KB
-
 population-earth1.png 1,600 × 800; 371 KB
-
 population-earth2-cropped.png 2,160 × 880; 397 KB
-
population.data-float64-8640x4320 ; 26.73 MB
-
 solar-land-requirements.png 1,600 × 800; 388 KB
-
sr28-collated.csv ; 7.68 MB
-
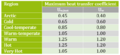
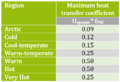 u value walls table.png 456 × 310; 16 KB
-
 u value windows table.png 613 × 283; 19 KB
-
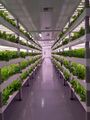 vertical-farm-1.jpg 480 × 640; 91 KB
-
-
yields.data-float64-895x1 ; 7 KB


