File:energy-demand-pie1.png: Difference between revisions
(Pie chart of energy usage {{pn|TODO: methodology will be added here soon}}) |
|||
| Line 1: | Line 1: | ||
== Summary == | == Summary == | ||
Pie chart of [[energy]] usage | Pie chart of [[energy]] usage, based on countries where precise data is most available. | ||
{{pn|TODO: | {{pn|TODO: Methodology will be added here soon.}} | ||
Revision as of 07:32, 16 October 2023
Summary
Pie chart of energy usage, based on countries where precise data is most available.
TODO: Methodology will be added here soon.
File history
Click on a date/time to view the file as it appeared at that time.
| Date/Time | Thumbnail | Dimensions | User | Comment | |
|---|---|---|---|---|---|
| current | 19:57, 26 March 2024 |  | 812 × 1,052 (341 KB) | Elie (talk | contribs) | Removed the lightning bolt, made it more clear that "watts" includes more than just electricity |
| 07:15, 16 October 2023 | 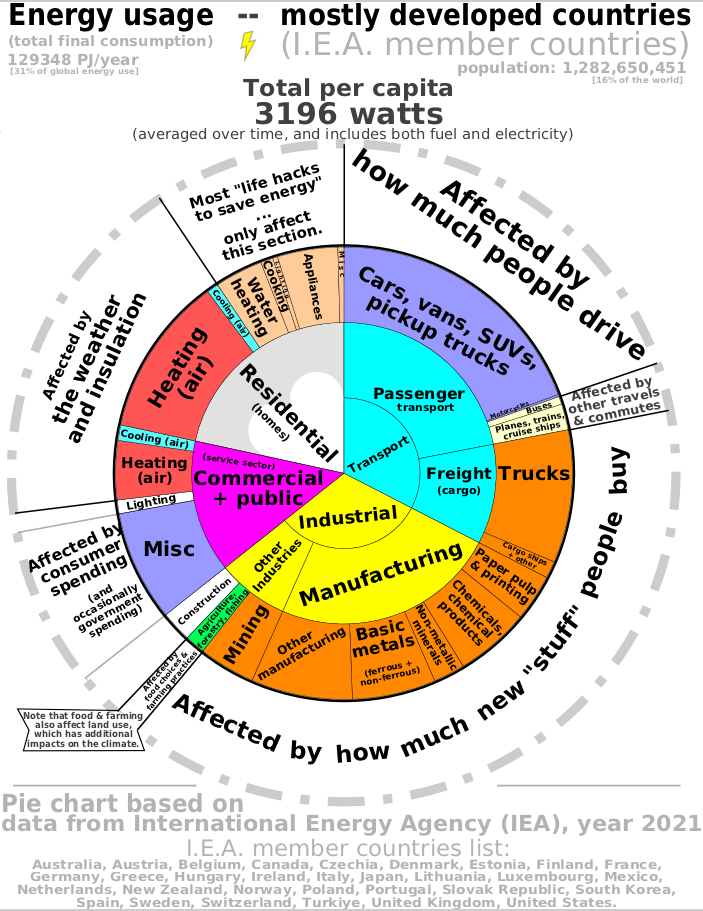 | 703 × 911 (256 KB) | Elie (talk | contribs) | Pie chart of energy usage {{pn|TODO: methodology will be added here soon}} |
You cannot overwrite this file.
File usage
The following 5 pages use this file:
- Energy
- Frugalism
- Reduce energy demand
- File:energy-usage-affected-by.png (file redirect)