Greenhouse gases
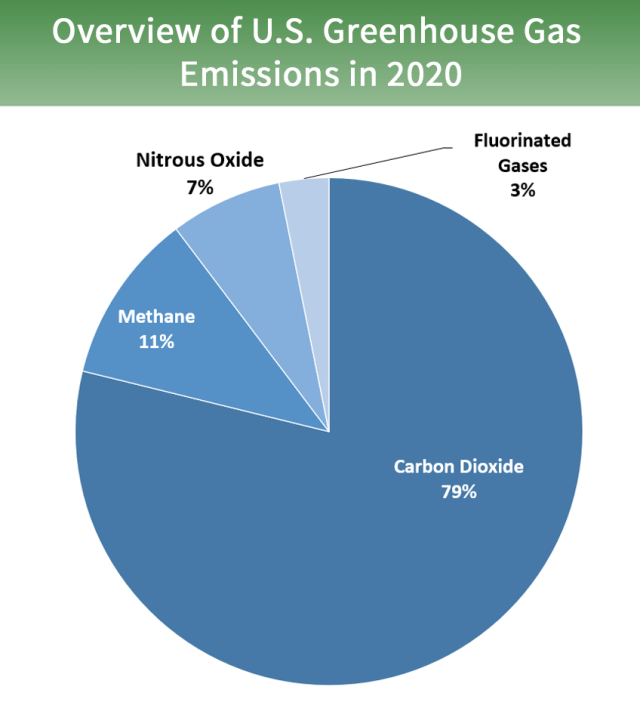
Total U.S. Emissions in 2020 = 5,981 Million Metric Tons of CO2 equivalent (excludes land sector). Percentages may not add up to 100% due to independent rounding.
The pie chart percentages are of total warming effect (CO2 equivalent), not the mass of the gases.
Gases by potency
Some gases are far more potent than others, by mass.
Luckily, the more potent gases are emitted in such vastly smaller quantities that they don't contribute as much to global warming as CO2 does (see pie chart above).
| Name | GWP Global Warming Potential (per unit mass, 100-year timescale) | Atmospheric longevity | |
|---|---|---|---|
| CO2 | Carbon dioxide | 1 | 300 to 1,000 years |
| CH4 | Methane | 25 | 12 years |
| N2O | Nitrous Oxide | 273 | 114 years |
| CF4 | Tetrafluoromethane | 7,380 | 50,000 years |
| C2F6 | Hexafluoroethane | 12,400 | 10,000 years |
| SF6 | Sulfur hexafluoride | 23,900 | 3,200 years |
