Uploads by Elie
This special page shows all uploaded files.
| Date | Name | Thumbnail | Size | Description | Versions |
|---|---|---|---|---|---|
| 23:51, 26 August 2022 | fao-livestock-primary.csv (file) | 4.54 MB | Data on the primary production of animal products such as meat, milk, and eggs. Data downloaded from [https://www.fao.org/faostat/en/#data/QCL FAOSTAT] * Domain: "Crops and livestock products" (QCL) * Areas: "All countries" + "World (Total)" ** Exception: "China, mainland" is omitted to avoid double counting. The crops are already counted in "China". Also because, most other datasets can be joined on the string "China" but not "China, mainland". ** Using ISO3 area codes ** "... | 1 | |
| 23:36, 26 August 2022 | fao-crops-primary.csv (file) | 10.6 MB | 1 | ||
| 23:23, 26 August 2022 | sr28-collated.csv (file) | 7.68 MB | 1 | ||
| 13:07, 14 August 2022 | food-crop-production1-if-crop-choices.png (file) |  |
787 KB | Made the legend bigger | 2 |
| 13:06, 14 August 2022 | food-crop-production1.png (file) |  |
736 KB | Made the legend bigger | 2 |
| 14:02, 7 August 2022 | country-and-continent-codes-list-csv csv.csv (file) | 12 KB | Table of countries and their Country Codes (ISO3, M49, etc) and the continents they are on. Source: [https://datahub.io/JohnSnowLabs/country-and-continent-codes-list] | 1 | |
| 04:06, 7 August 2022 | borders-black-on-white.png (file) | Error creating thumbnail: File with dimensions greater than 12.5 MP |
677 KB | World map: Outlines of countries, black on white Projection: equirectangular (geographic) This image was generated by Code:borders-black-on-white.c which uses File:countries.data-int16-8640x4320 (data from NASA) as input. | 1 |
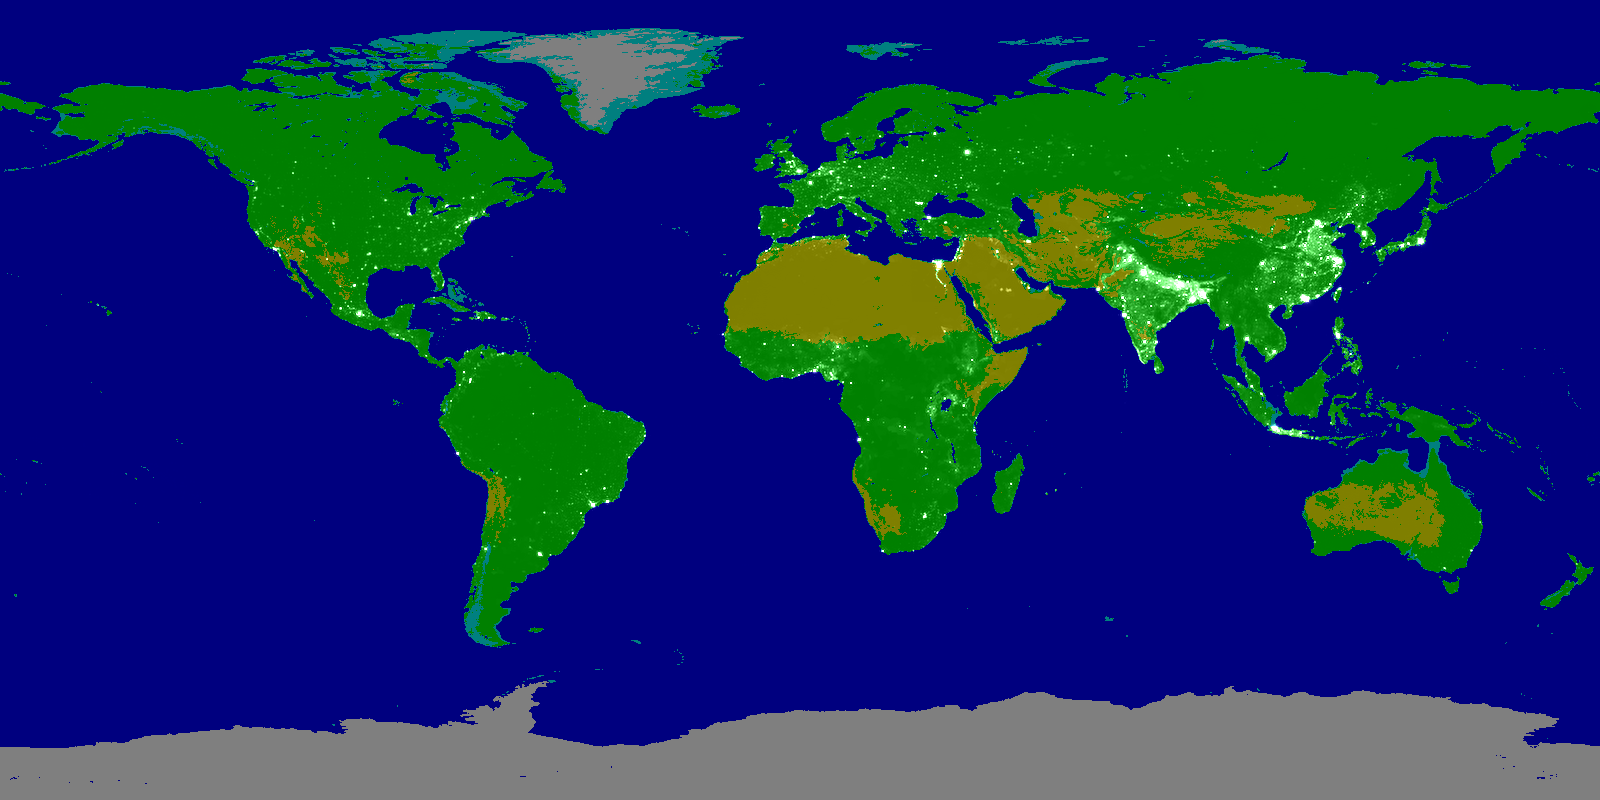
| 03:52, 7 August 2022 | population-earth1.png (file) |  |
371 KB | An Term:isochromic map of the world population, superimposed on a pastel-color background that shows land, water, and borders. Everything in black is population. Note: Some border lines may be completely obscured by populations (especially India's borders with Bangladesh, Pakistan, and Bhutan). Still better than the opposite (letting the border lines obscure the populations). | 1 |
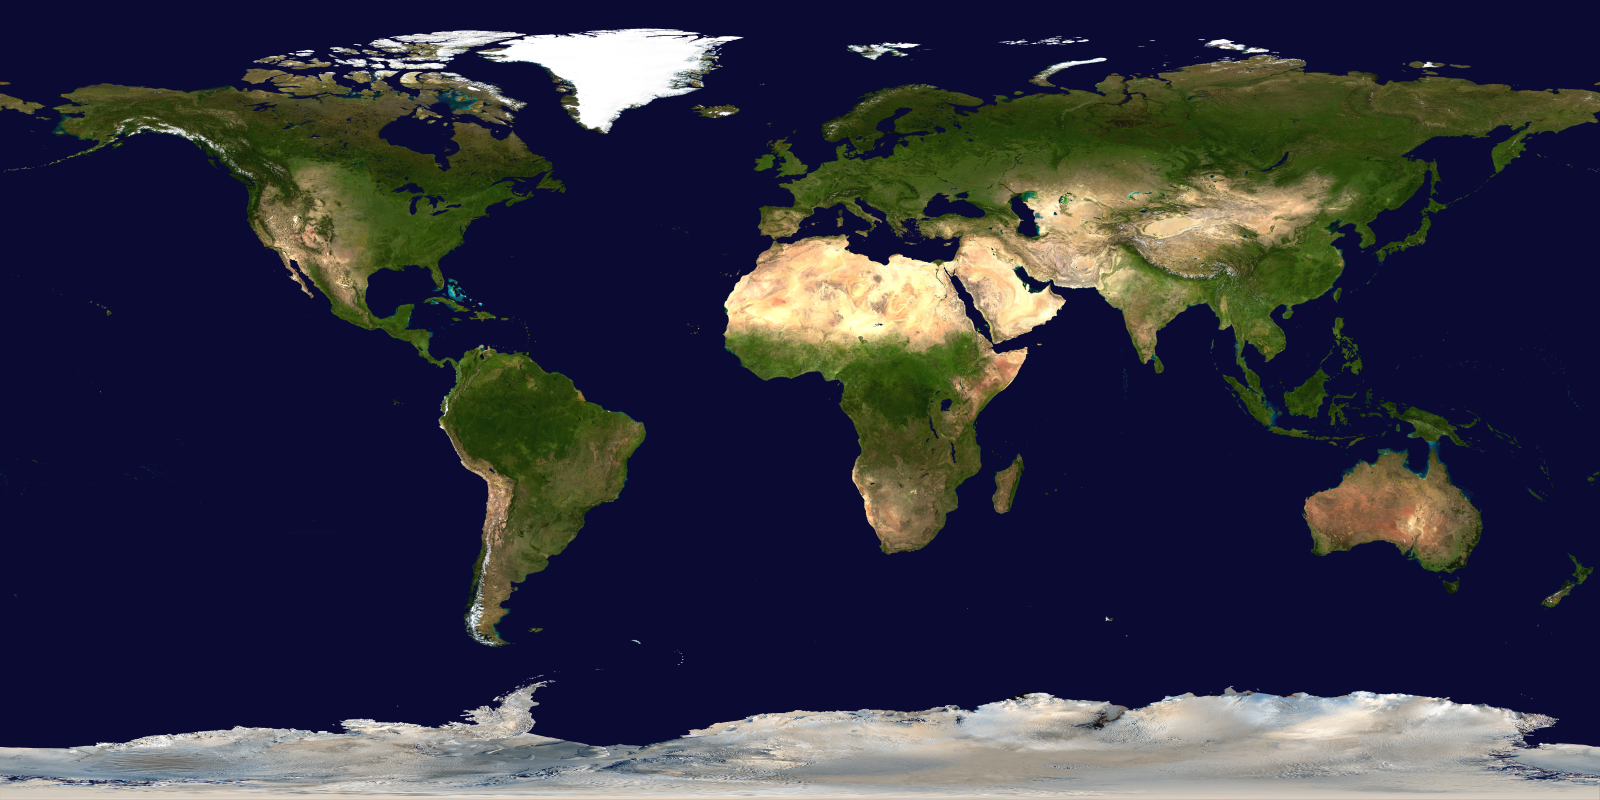
| 03:35, 7 August 2022 | PRIMARY-Blue Marble 2002.png (file) |  |
903 KB | NASA's original Blue Marble Map of the Earth from satellite imagery Source: https://visibleearth.nasa.gov/collection/1484/blue-marble | 1 |
| 03:28, 7 August 2022 | blue-marble-posterized.png (file) |  |
30 KB | 1 | |
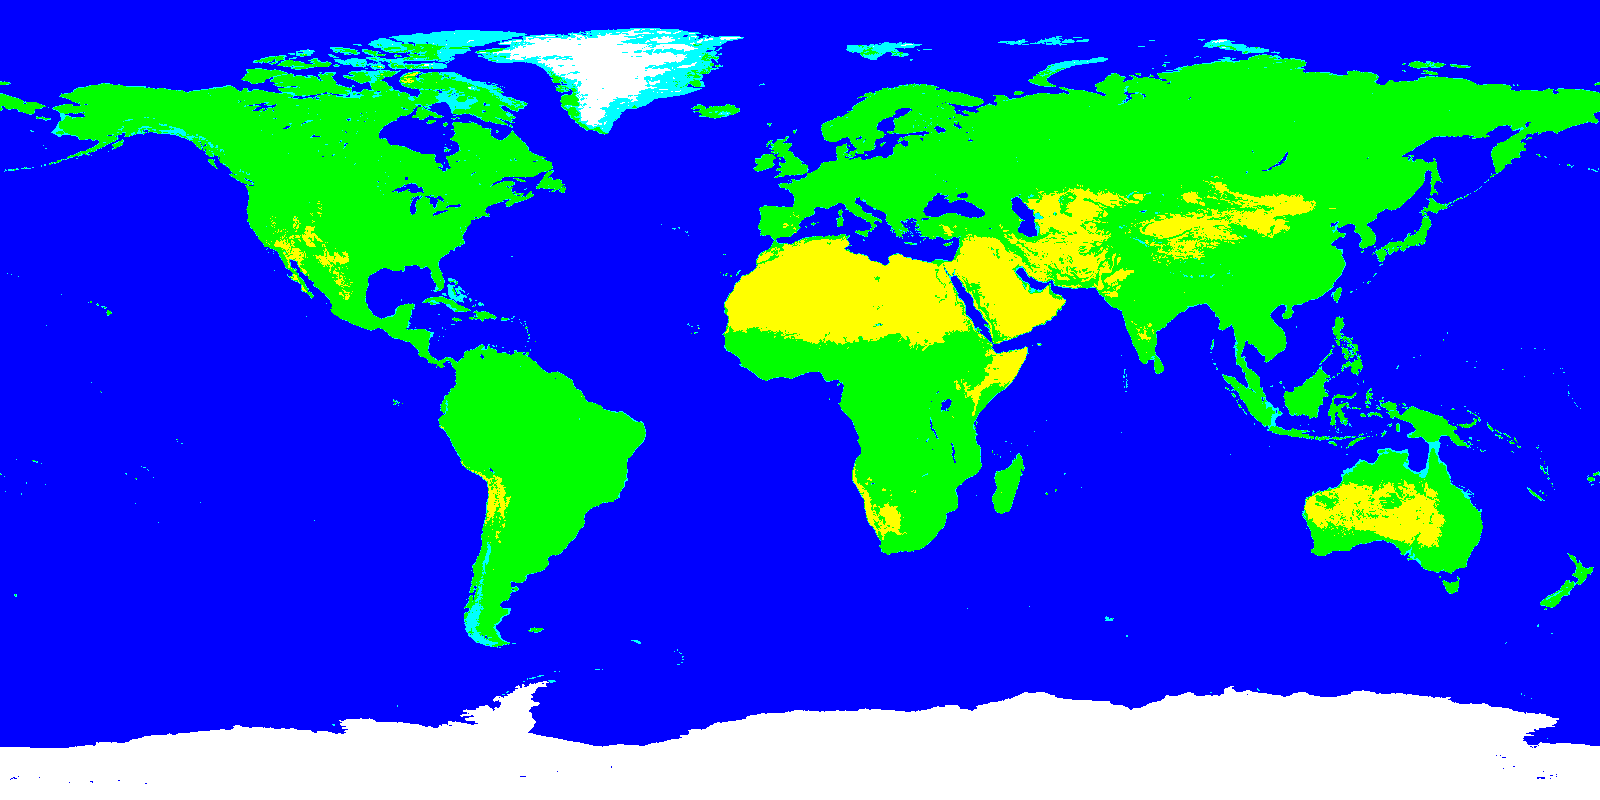
| 02:59, 7 August 2022 | solar-land-requirements.png (file) |  |
388 KB | World map: If all energy came from solar panels, how much land would we need? The land is shown in white. We would need approximately 0.8% of Earth's surface. <small>Just for comparison, crop land is about 2.9% of Earth's surface, and pasture land is about 5.4% of Earth's surface.</small> ==Methodology== Land required for solar panels, if * all energy came from solar photovoltaics, and * everyone on Earth lived a "first-world" lifestyle. Map projection: equirectangular Not counted in... | 1 |
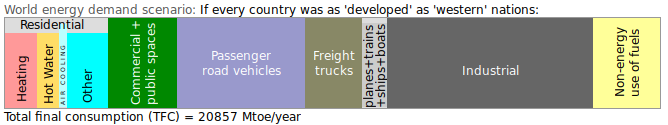
| 03:39, 31 May 2022 | energy-demand-if-developed.png (file) | 22 KB | Methodology: see energy demand scenarios. | 1 | |
| 03:37, 31 May 2022 | energy-demand-status-quo.png (file) |  |
17 KB | Methodology: see energy demand scenarios. | 1 |
| 03:50, 22 May 2022 | map-energy-population.png (file) | Error creating thumbnail: File with dimensions greater than 12.5 MP |
3.77 MB | 1 | |
| 18:24, 18 May 2022 | crop-yields-map.png (file) |  |
3.42 MB | 1 | |
| 18:21, 18 May 2022 | food-funnel-old.png (file) |  |
45 KB | 1 | |
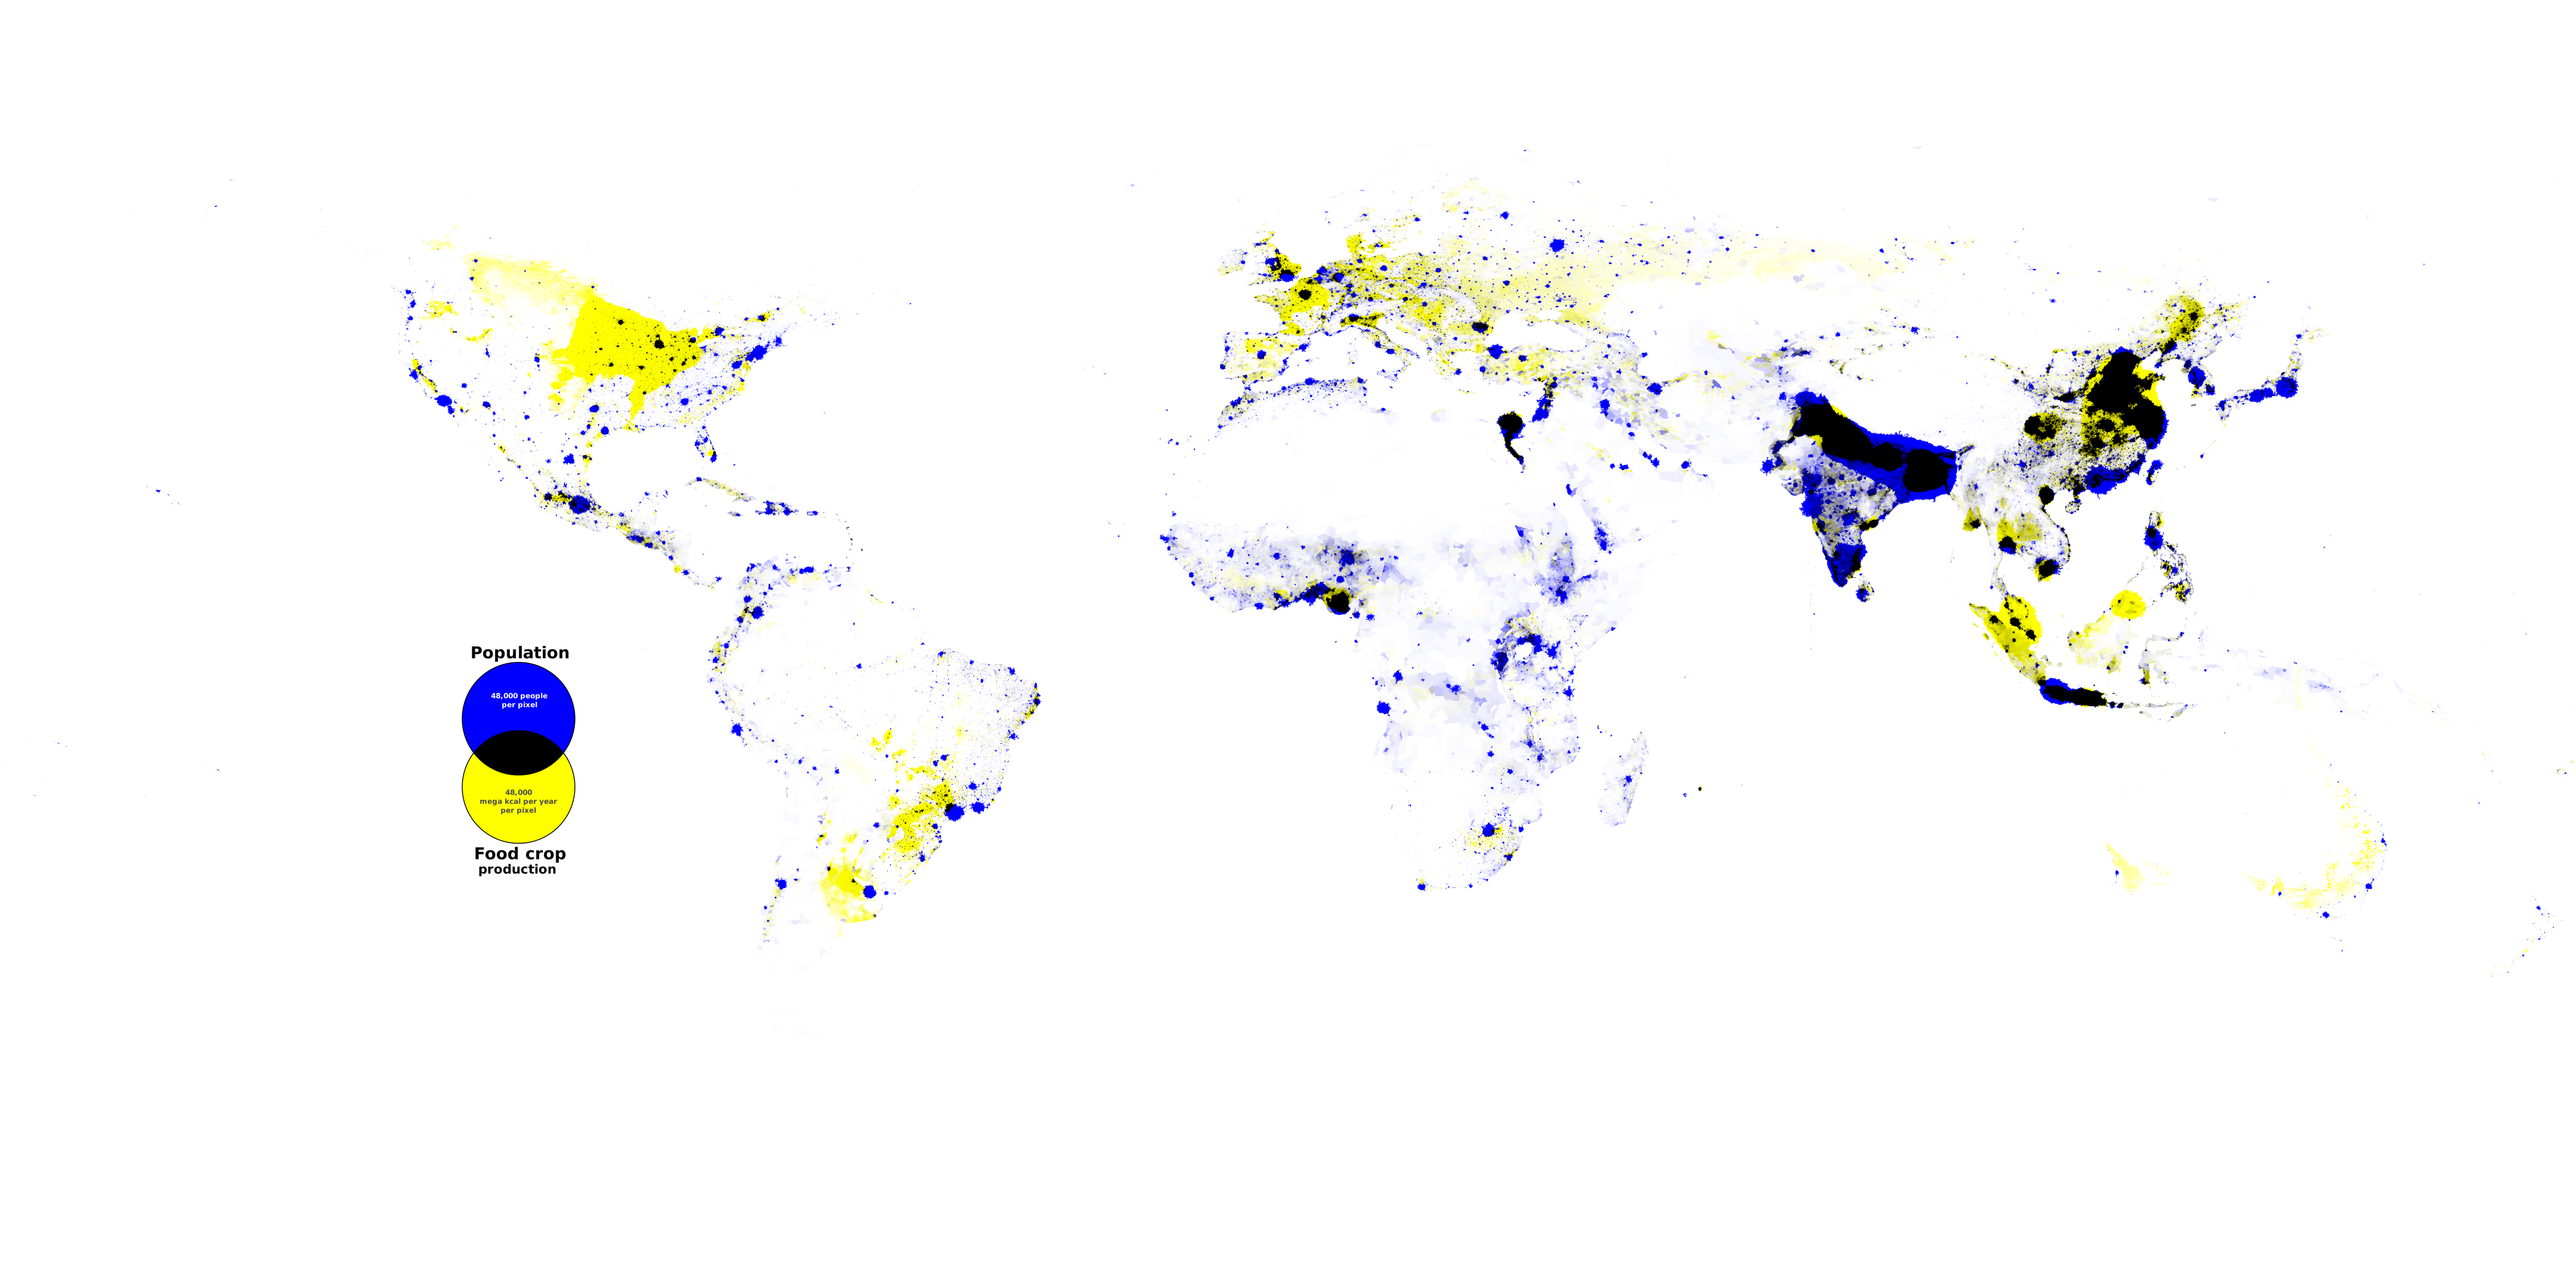
| 18:13, 18 May 2022 | map-population-foodProduction.png (file) |  |
1.75 MB | 1 |