File:fossil-fuels-ghg-by-energy.png
Size of this preview: 722 × 600 pixels. Other resolution: 944 × 784 pixels.
Original file (944 × 784 pixels, file size: 44 KB, MIME type: image/png)
Summary
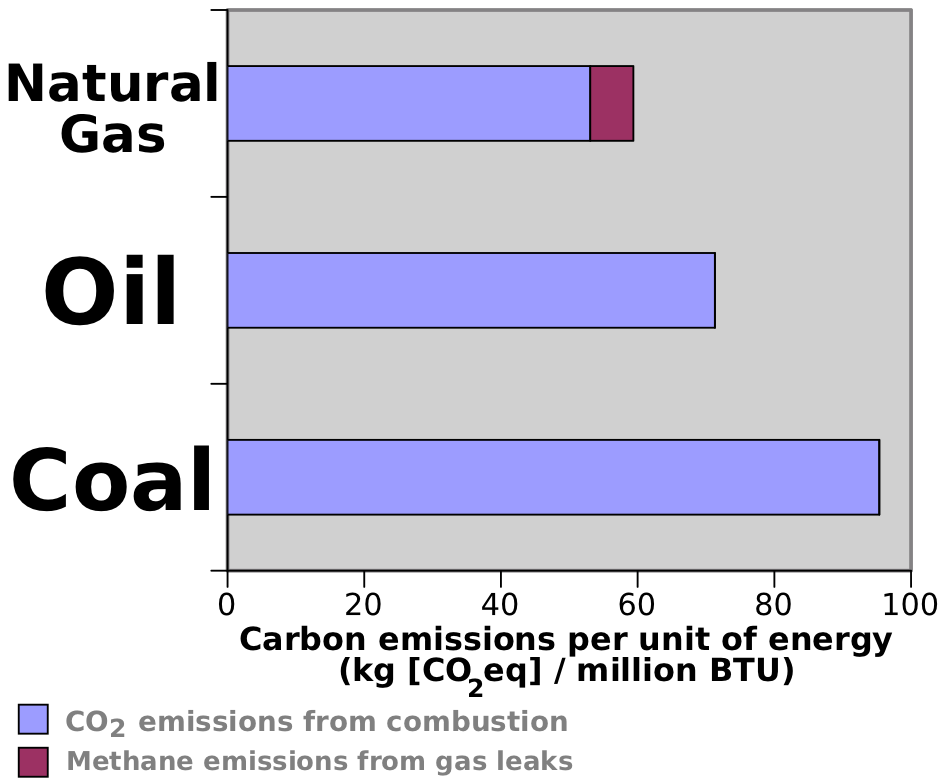
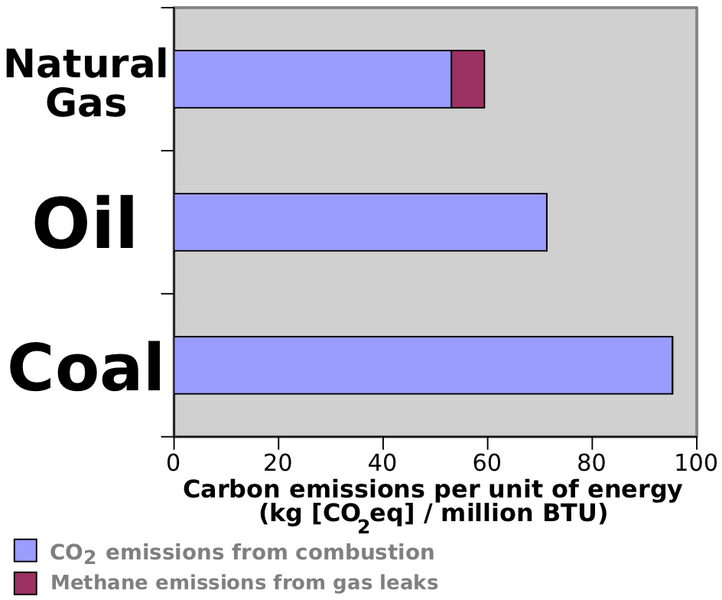
Greenhouse gas emissions of the 3 fossil fuels, per unit of energy.
Numbers
Emissions measured in CO2eq per unit of thermal energy, for each fuel:
coal.ghg_by_energy
95.35 kg / million btu
CO2 emissions of burning coal
https://www.eia.gov/environment/emissions/co2_vol_mass.php
gasoline.ghg_by_energy
71.30 kg / million btu
CO2 emissions of burning gasoline
https://www.eia.gov/environment/emissions/co2_vol_mass.php
natural_gas.ghg_by_energy
53.07 kg / million btu
CO2 emissions of burning natural gas
Does not include the fugitive methane emissions from unburned fuel. Those vary by how the gas is burned.
https://www.eia.gov/environment/emissions/co2_vol_mass.php
https://www.eia.gov/environment/emissions/co2_vol_mass.php
usa.natural_gas.fugitive_ghg
176.1 million tonnes / year
Greenhouse gas CO2eq of fugitive methane leaks from all natural gas infrastructure in the USA
Environmental Protection Agency (EPA)
Inventory of U.S. Greenhouse Gas Emissions and Sinks: 1990-2014
https://www.epa.gov/ghgemissions/inventory-us-greenhouse-gas-emissions-and-sinks-1990-2014
2016 Complete Report (PDF)
Using data from 2014
Inventory of U.S. Greenhouse Gas Emissions and Sinks: 1990-2014
https://www.epa.gov/ghgemissions/inventory-us-greenhouse-gas-emissions-and-sinks-1990-2014
2016 Complete Report (PDF)
Using data from 2014
usa.natural_gas.energy
27.9 quadrillion btu / year
U.S. energy consumption from natural gas combustion only
Environmental Protection Agency (EPA)
Inventory of U.S. Greenhouse Gas Emissions and Sinks: 1990-2014
https://www.epa.gov/ghgemissions/inventory-us-greenhouse-gas-emissions-and-sinks-1990-2014
2016 Complete Report (PDF)
Datapoint was found on page 115, from pie chart and line graph, using data from 2014
Inventory of U.S. Greenhouse Gas Emissions and Sinks: 1990-2014
https://www.epa.gov/ghgemissions/inventory-us-greenhouse-gas-emissions-and-sinks-1990-2014
2016 Complete Report (PDF)
Datapoint was found on page 115, from pie chart and line graph, using data from 2014
natural_gas.fugitive_ghg_by_energy
usa.natural_gas.fugitive_ghg / usa.natural_gas.energy
Fugitive emissions (CO2eq) of natural gas, per unit energy
Average based on US datapoints.
Coal: (calculation loading)
Oil (gasoline is the most popular fuel obtained from crude oil): (calculation loading)
Natural gas, which also has fugitive emissions
File history
Click on a date/time to view the file as it appeared at that time.
| Date/Time | Thumbnail | Dimensions | User | Comment | |
|---|---|---|---|---|---|
| current | 23:30, 31 July 2023 | | 944 × 784 (44 KB) | Elie (talk | contribs) | Greenhouse gas emissions of the 3 fossil fuels, per unit of energy |
You cannot overwrite this file.
File usage
The following page uses this file: