Climate change: Difference between revisions
No edit summary |
No edit summary |
||
| Line 1: | Line 1: | ||
[[Category:Problems]] | [[Category:Problems]] | ||
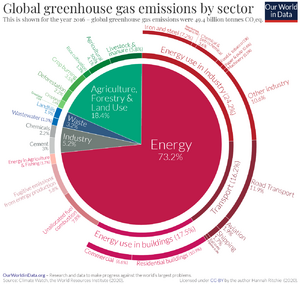
[[File:Emissions-by-sector-–-pie-charts.png|thumb|GHGs (greenhouse gases) (such as CO<sub>2</sub>) are the gases that cause climate change. '''This is a pie chart of where they come from.''']] | |||
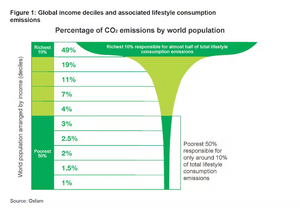
[[File:carbon-inequality1.png|thumb|Note that half of emissions come from the richest 10% of the world, which includes '''you''' if you're middle-class in a developed country. '''That's the target audience for the "personal actions"''' section of this page.]] | |||
For an introduction, read [[What is climate change]]. | For an introduction, read [[What is climate change]]. | ||
==Biggest factors== | ==Biggest factors== | ||
Most of the world's emissions are affected by either... | Most of the world's emissions are affected by either... | ||
Revision as of 15:54, 22 March 2024


For an introduction, read What is climate change.
Biggest factors
Most of the world's emissions are affected by either...
- How much new "stuff" gets made. Pie chart sections: "Industry", "Energy Use In Industry", and part of "Fugitive Emissions In Energy Production" (as natural gas is used in the industries).
- How much people drive/fly. Two thirds of the "Transport" section of the pie chart (because the other third is for transporting goods; the ratio isn't found in this pie chart, but it's found in another pie chart).
- Heating & cooling homes and other buildings. Most of the "Energy Use In Buildings" section is heating & cooling (not lights or computers etc). The pie chart doesn't specify this, but another pie chart does. Heating & cooling also contribute to "Fugitive Emissions In Energy Production", because natural gas is often used in heating and in generating the electricity that powers air conditioners.
- Food production. Most of the "Agriculture, Forestry & Land Use" section goes towards producing food. Also note: This section affects more than just climate change, it also affects most of habitat loss.
This provides some perspective on the most significant actions to take.
Actions to take
If you think there's anything more significant to add to this list, leave a comment on the talk page.
Personal actions
- Frugalism
- Driving less (or not at all)
- Plant-based food
- Not wasting food
Collective actions ✊🏻✊🏽✊🏿
- Stop planned obsolescence and promote right to repair
- Make neighborhoods walkable and improve public transit
- Replace all fossil fuel energy with renewables or nuclear - but this requires major tech innovations that might not come soon enough.
- This would be a lot easier if energy consumption was lower - so in any case, the other actions on this page still matter more than ever.
For those who are skeptical
See also
- Deforestation - another environmental problem, which affects more than just the climate.
- Longer list of climate change solutions - most of which have only small potential.