Energy demand scenarios
If we want a better world, we have to get a sense of how much energy it would take. First we look at the status quo, then we envision some hypothetical scenarios.
File:energy-demand-developed.png
Methodologies
First we define the scale (X axis) (same for every bar graph):
- 1 pixel = 24 Mtoe/year
Status quo
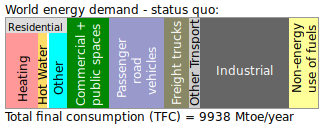
Using data from IEA (international energy agency):
- (1) IEA, Key World Energy Statistics 2020 - Page 47 - Simplified energy balance table - World energy balance, 2018
- (2) IEA (2021), Energy Efficiency Indicators: Overview, IEA, Paris - https://www.iea.org/reports/energy-efficiency-indicators-overview
Source (1) has general stats about worldwide total final energy consumption (TFC), and what share of that is used in industry and transport.
Source (2) has more detailed breakdowns for energy usage types, but they are only based on a handful of countries (mostly developed countries).
We use these together, to estimate how energy is used globally.
Industrial: global data from (1)
Transport: take subcategories from (2), scale them to match the global demand in (1)
Residential & Commercial: take subcategories from (2), scale them to match the remainder of global demand in (1)
Non-energy use of fuels: global data from (1)
If every country was as "developed" as western nations
This will be filled in soon.
Minimum
This bar graph has not been made yet. It will be based on the minimal consumption scenario.
